
Key takeaways
- Of 55,660 Amazon UK seller profiles, 55.5% declare a China business address, and China and Hong Kong together make up 60.1%.
- The median priced product costs £16.99, and 49.5% of priced products end in .99.
- Of the products with offer data, 72.1% have one seller, and Amazon is among the sellers on 17.2% of the 197,022 products.
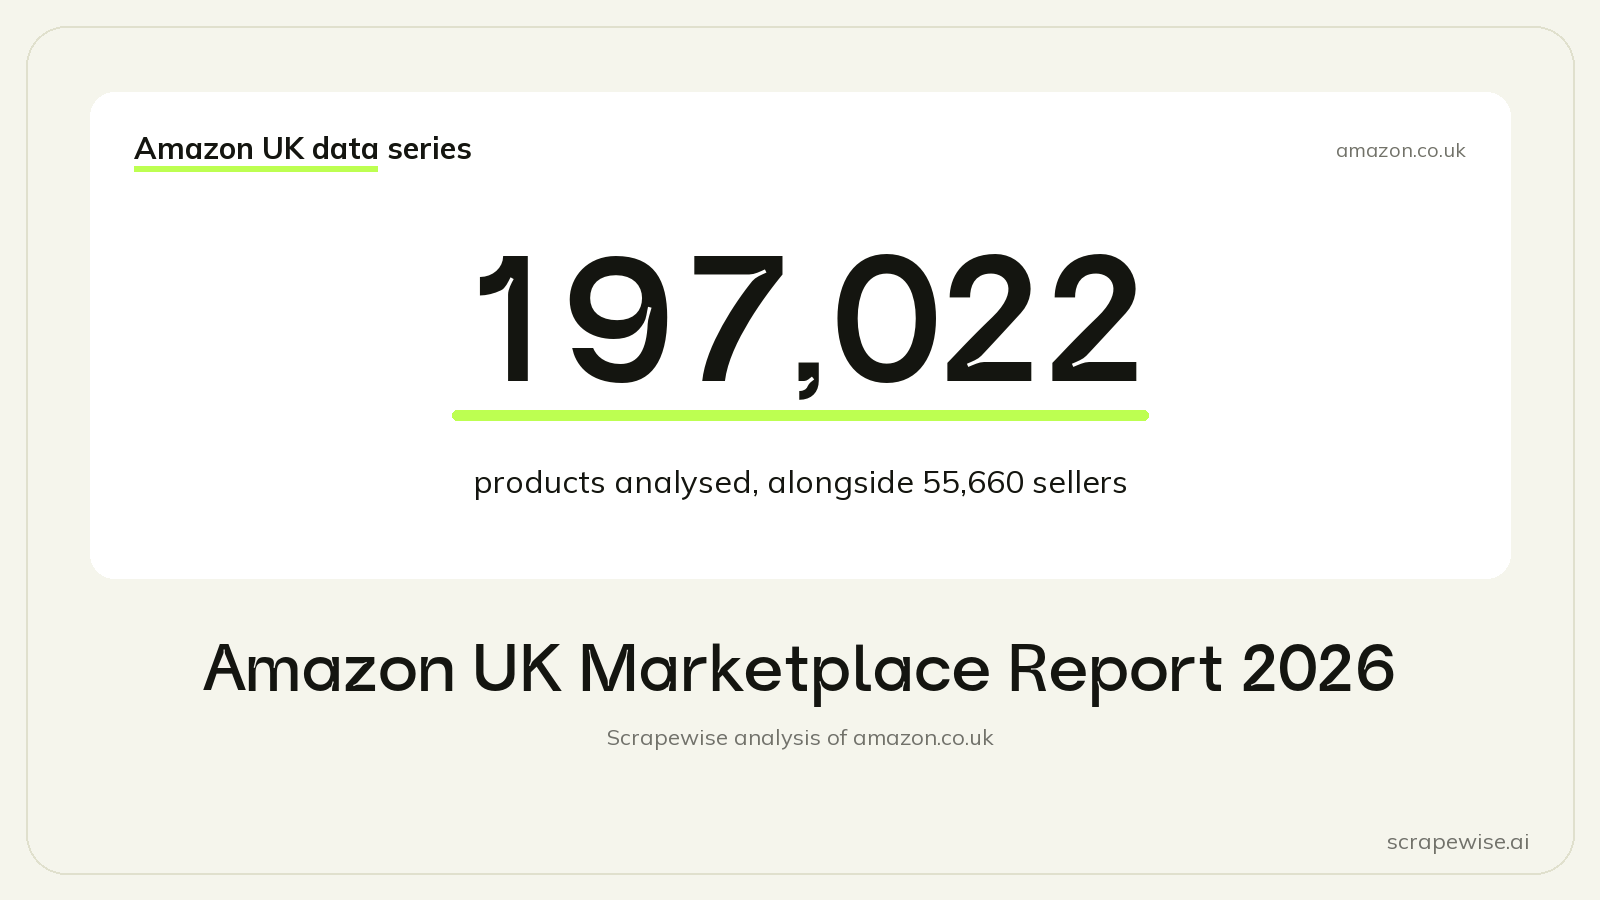
Our Amazon UK marketplace statistics for 2026 come from 197,022 products and 55,660 seller profiles, found through 868 shopping keywords in 16 categories. We collected them from amazon.co.uk on 23 to 24 September 2026. This page gathers the headline numbers, the method and a link to every deep dive in the series.
Key Findings at a Glance
One number from each part of the study, each with a link to the post that covers it in depth.
- Sellers: more than half of seller profiles, 55.5% of 55,660, declare a China business address, and 29.2% declare a UK one. Details in Amazon UK sellers by country.
- Seller size: the top 1% of linked sellers hold 41% of all seller-product links in our sample. See the largest Amazon UK sellers.
- Prices: the median priced product costs £16.99. Toys & Games is the dearest category at £28.49 and Beauty & Personal Care the cheapest at £12.68. See average price on Amazon UK.
- Demand: the "bought in past month" labels in our sample add up to at least 29.5 million units a month. See best selling categories on Amazon UK.
- Ratings: the median rated product scores 4.4 stars, and 89% of rated products score 4 stars or more. See what is a good Amazon rating.
- Search: in the same search, page-1 products have a median of 8.4x the reviews of products on page 5 and beyond. See how to rank on page 1 of Amazon.
- Ads: in the same search, sponsored listings typically cost 41% more than organic results. See Amazon sponsored products price.
- Pricing psychology: 49.5% of priced products end in .99, and £9.99 is the most common price of all. See psychological pricing on Amazon.
- Competition: 72.1% of products with offer data have one seller, and 3.6% have ten or more. See Amazon buy box competition.
- Amazon as a seller: Amazon is among the sellers on 17.2% of all products, but on 44.0% of products labelled 1K+ bought in past month. See does Amazon compete with its sellers.
- Listings: the median title runs 107 characters, and 235 titles name 2025 as their year. See how long product titles run on Amazon.
Sellers: Where They Are Based and How Big They Are
We read the public profile of every third-party seller we met in the search results. Each profile shows the business address the seller declares to Amazon, and we grouped sellers by the country in that address.
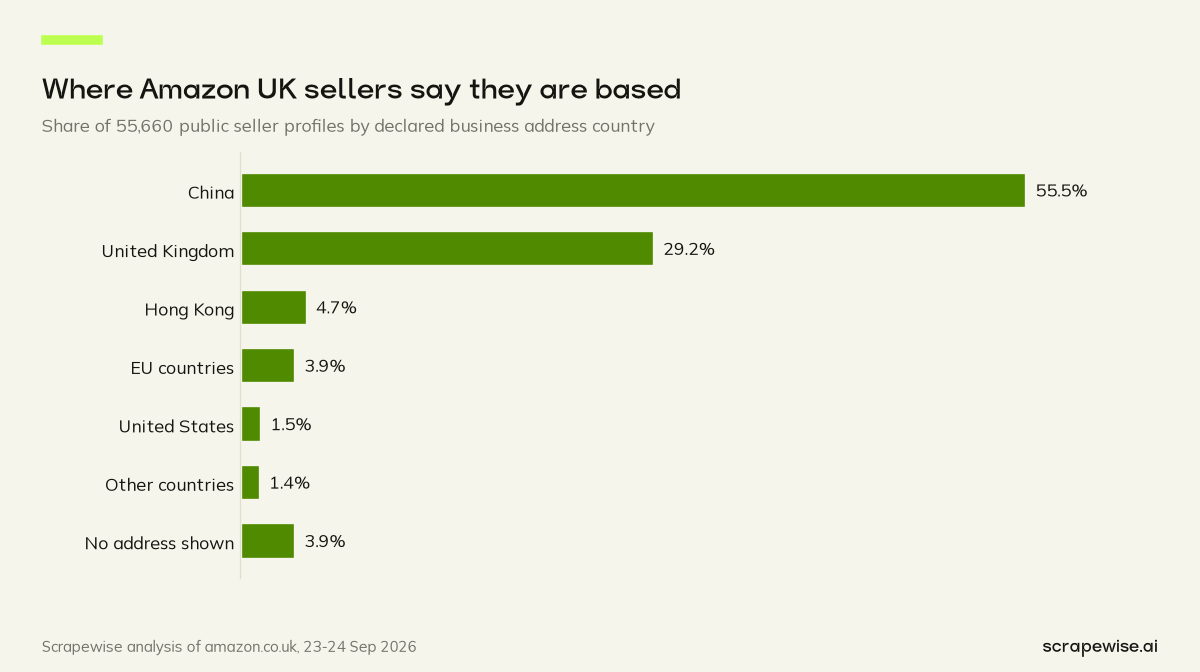
China and Hong Kong together account for 60.1% of seller profiles. A seller count treats a one-product shop and a large retailer the same way, so we also looked at single-seller listings, where the seller is not in doubt. On those 141,582 single-seller products, China-based sellers hold 48.7% of listings but 36.4% of the minimum unit volume. UK-based sellers hold 27.4% of single-seller listings and 31.1% of the units. Amazon's own single-seller listings are only 7.5% of the total, yet they carry 18.1% of the units.
Size is lopsided too. Of the 51,458 sellers linked to products in our sample, 41.7% appear on exactly one product. At the other end, the top 1% of linked sellers hold 41% of all seller-product links, and four in five of them declare a UK address. Links measure how broad a catalogue is, not how much it sells.
Feedback scores tell another story. Of the 51,374 rated sellers, 41.3% show a perfect 100% score. Within that 100% group, the median seller has 33 ratings and 32.3% have fewer than 10. UK-based sellers carry more ratings: a median of 200 against 60.5 for China-based sellers. The gap is widest at the top, where 7.4% of UK-based sellers pass ten thousand ratings against 0.2% of China-based sellers. More on this in is 100% positive feedback on Amazon good.
The profiles also carry business details. 79.4% of sellers show a VAT number, which we record but do not validate; the split by country is in Amazon UK VAT numbers by seller country. Contact details are rare: 2.0% of profiles list an email and 8.7% a phone number, which is why contacting an Amazon seller directly usually means Amazon's own messaging. Among UK-address sellers, the Manchester postcode area leads with 4.5%, and up to 61 sellers share one UK address, most likely a formation or virtual office. The map is in where Amazon UK sellers are based.
Categories and Demand
Prices differ a lot by category. Among the 193,782 priced products, the median is £16.99. The cheapest tenth of priced products cost £6.59 or less, and the dearest tenth cost £69.99 or more.
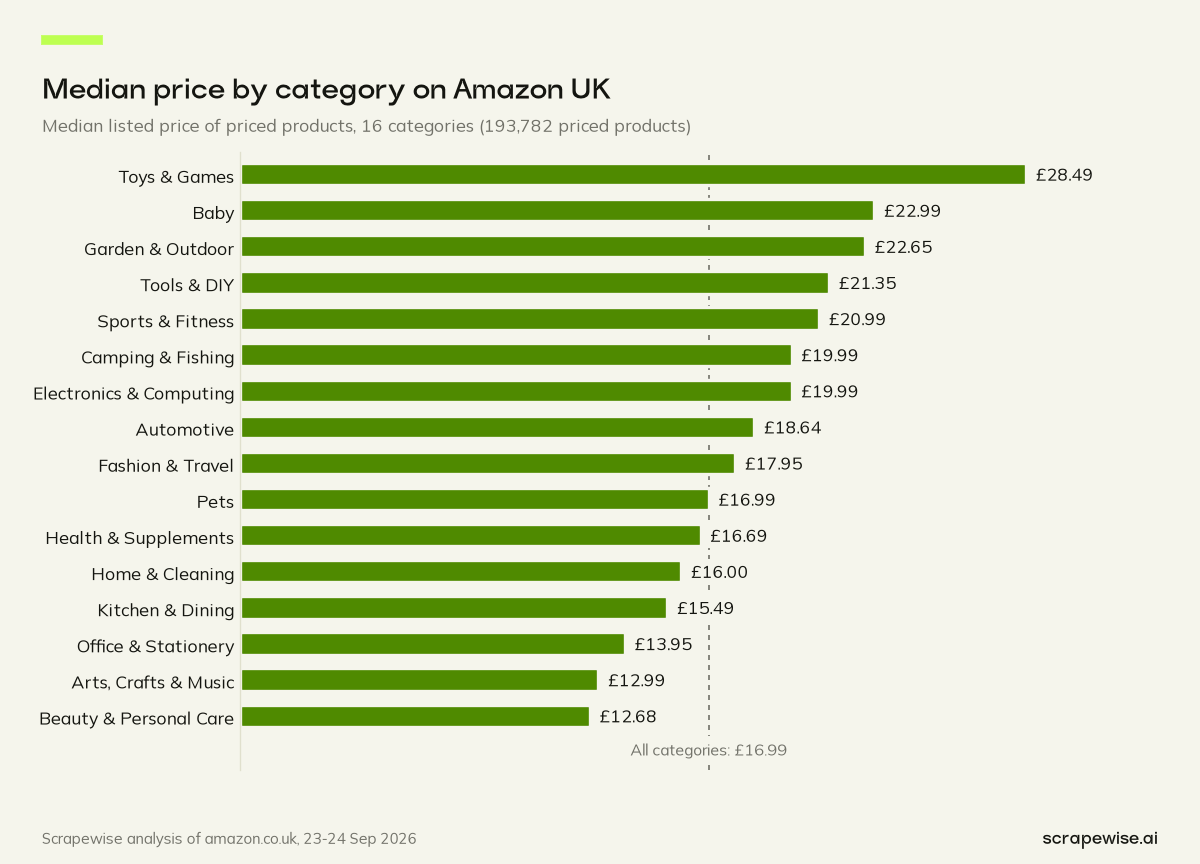
Toys & Games has the highest median price at £28.49, and Beauty & Personal Care the lowest at £12.68. Across all priced products, the price spread (p90 over p10, defined below) is 10.6x. A single search can spread even wider: chess sets spread 21.3x from the cheap end to the dear end.
Demand is harder to measure, because Amazon shows no sales figures. It does show a label such as "1K+ bought in past month" on 36.6% of products. The label is a rounded minimum, so adding the label floors gives a lower bound: at least 29.5 million units a month across the sample. Beauty leads with at least 6.7 million units a month and the highest labelled share, 58%. Sports & Fitness has the lowest labelled share, 20%.
The category deep dives go further:
- The Amazon UK beauty market: the most labelled category and the cheapest median price.
- The Amazon UK toy market: LEGO sets carry a label on 99.6% of listings and have a median of 4.8 stars among rated listings.
- Selling pet food on Amazon UK: dog food listings have a mean of 7.70 sellers each.
- Electronics prices on Amazon UK: drone prices spread 27.8x.
- Fitness equipment prices on Amazon UK: 71.4% of core slider listings have no reviews at all.
- The most bought items on Amazon UK: cat food alone carries at least 458,000 units a month in labels.
Ratings and Reviews
Among the 182,700 rated products, the median score is 4.4 stars and 89% score 4 stars or more. Low scores are rare: 3.5% of rated products sit under 3.5 stars. A score of 4.0 stars is therefore lower than most rated products get.
Perfect scores rest on very little. The 10,831 products rated 5.0 stars have a median of 2 reviews, and 84.1% of them have 5 or fewer. The full breakdown is in is 5 stars on Amazon trustworthy.
Reviews are concentrated. The top 1% of products hold 37% of all reviews. Review counts on the 182,700 rated products add up to 285.6 million. We counted them. We did not read them. Amazon rounds counts above a thousand and often pools reviews across variants of the same product, so treat the total as approximate.
Reviews can also hint at sales. For 66,181 products with 20 or more reviews, the median is at least 0.29 units a month per lifetime review, based on label floors. The method is in Amazon sales estimates from reviews.
At the bottom, 7.3% of products have no reviews at all. And 345 rated products under 3.5 stars still show a "100+ bought in past month" label. Those are covered in the worst rated products on Amazon UK.
Search, Badges and Ads
We captured up to 7 result pages per keyword, and page 1 looks nothing like the pages behind it. Rated products on page 1 have a median of 589 reviews. On page 6 the median is 63.
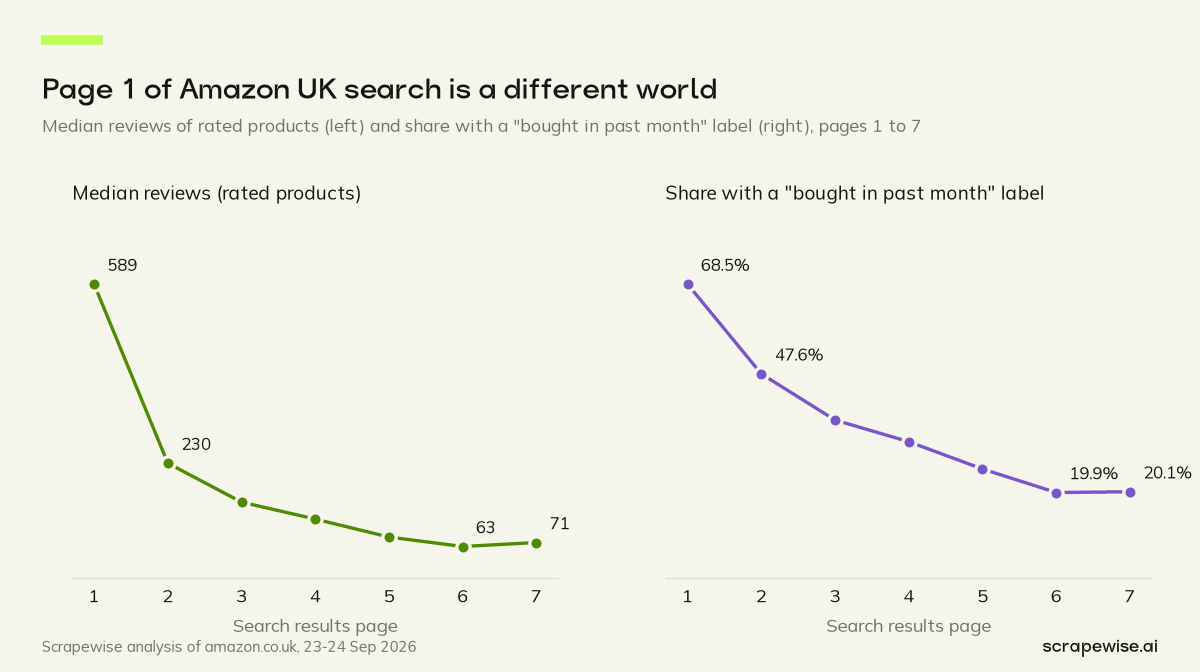
A like-for-like view gives the same answer. Within the same search, page 1 has a median of 8.4x the reviews of page 5 and beyond, across 863 keywords. Labels follow the same curve: 68.5% of page-1 products show a "bought in past month" label, against 19.9% on page 6. Titles get shorter near the top, with a median of 98 characters on page 1 against 107 across all products.
Amazon's Choice badges are rare and sit up front. We found 625, and every one was on page 1. Badge holders have a median of 2,200 reviews against 137 for products with no badge. See how to get the Amazon's Choice badge.
Sponsored listings lean to the pricier end. Across 543 keywords, the median same-search ratio of sponsored to organic prices is 1.41, and sponsored listings were cheaper in only 14% of those searches. Our sponsored flags cover only the ad slots our parser recognised, so treat the sponsored share as a minimum.
Coupons are modest. The median "Save X%" coupon takes 11% off, across 6,207 coupon listings. The spread of discounts is in the average Amazon UK coupon discount.
Pricing Psychology
Charm pricing is the norm on Amazon UK. Of the 193,782 priced products, 49.5% end in .99, and the single most common price is £9.99. Amazon's own single-seller listings end in .99 only 27.4% of the time, far less often than its sellers.
Round thresholds matter too. We counted 854 products priced at £99 and some pence, against 88 at £100 and some pence: 9.7 times as many just below the line. The pattern and the smaller thresholds are in price threshold psychology.
Cheap products carry labels more often. Of priced products under £5, 53.6% show a "bought in past month" label, against 10.1% of those above £250. That is a correlation, not proof that a low price causes sales. See the best price point to sell on Amazon.
Beauty is the exception to the charm habit. Only 36.8% of priced beauty products end in .99, the lowest share of any category.
Competition
Most listings are not a contest. Of the 196,376 products with offer data, 72.1% have one seller, 9.7% have four to nine and 3.6% have ten or more. We capture about 11 sellers per product at most, so the busiest products are undercounted.
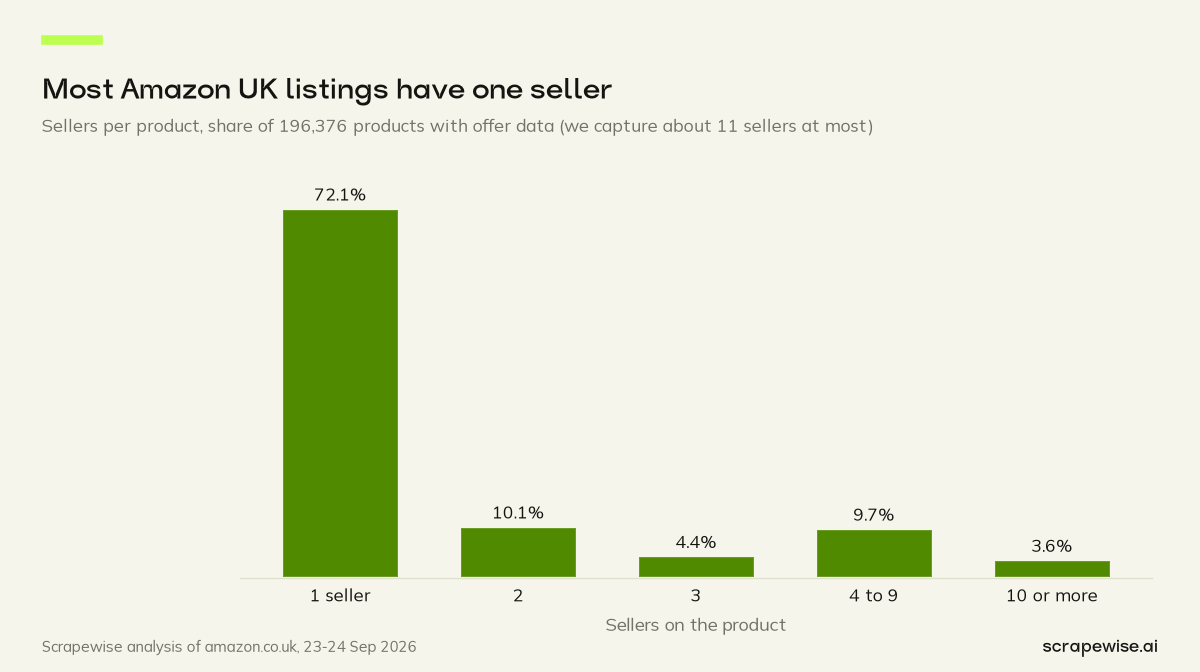
Crowded products show sales labels more often. Of products with ten or more sellers, 64.4% carry a "bought in past month" label, against 34.0% of single-seller products. LEGO sets are the most crowded search we saw, with a mean of 10.3 sellers per listing, and Amazon sells on 96.5% of them. The full ranking is in the most competitive Amazon UK products.
Amazon itself is among the sellers on 17.2% of all 197,022 products, about one in six. On the 7,181 products labelled 1K+ bought in past month, the share rises to 44.0%.
Seller country explains less than you might expect. Within the same keyword, across 641 keywords, the median prices of China and Hong Kong-based sellers and UK-based sellers are 3% apart. Two posts cover this: a like-for-like price test by seller country and where UK sellers and overseas sellers lead by category.
Identical titles are not identical products. We found 5,228 titles that appear on two or more product pages. The median price gap inside such a title group is 8.7%, and in 324 groups the dearest listing costs double the cheapest or more, often because of pack sizes. That is why same product, different price is usually a matching question. Our guides to product matching for price monitoring and AI product data matching explain how to match products on more than the title.
Seller Offers and the Buy Box
We also read the offer page of each product. It lists every seller's price, shipping, condition and delivery promise, and it shows which offer is featured. Six posts cover this layer, and each figure below uses only the products with offer data:
- On multi-offer products, the dearest new offer asks a median 1.34x the cheapest. See the price difference between sellers on Amazon.
- The featured offer, our stand-in for the Buy Box, is the cheapest new offer on 84.6% of multi-offer products, ties included. See does the lowest price win the Amazon Buy Box.
- 81.3% of new third-party offers from China-based sellers are shipped by Amazon (FBA). See FBA vs FBM statistics for Amazon UK.
- Where an offer sold by Amazon (any Amazon account) and a third-party offer are both new on the same product, Amazon's is cheaper on 52.1% of those products. See is Amazon cheaper than third-party sellers.
- Offers shipped by Amazon promise a median 4 days, whether the seller is based in China, the UK or the US. See Amazon UK delivery times by seller.
- On products with both a used and a new offer, the cheapest used offer is a median 10.0% below new. See Amazon used vs new prices.
Listings and Curiosities
Some findings are odd enough to deserve their own shelf. Two chocolate fountains were listed at £11,999.99 and £11,111.99, and neither had a single review. The highest price in the sample, £14,728.00, belonged to a heavy-lift drone. In all, 173 priced products cost more than £1,000 and 37 cost less than £1. Prices like these are why a price monitor needs outlier rules; see the most expensive items on Amazon UK.
At the cheap end, a skin cream priced at £1.28 carried about 16,500 reviews. More cheap favourites are in the cheapest things on Amazon UK.
What It Means for Sellers and Brands
The numbers point to a few practical habits for anyone who sells on Amazon UK or tracks it.
- Count listings and volume as well as sellers. A seller tally favours groups with many small shops, while single-seller listings and label floors are closer to the competition you actually meet.
- Treat page 1 as its own market. Reviews, labels and badges pile up there, so compare yourself with the page-1 products in your own searches, not with the category as a whole.
- Check price endings and thresholds in your category before copying a habit. Beauty prices end in .99 far less often than the rest of the marketplace.
- Watch where Amazon sells. It is on 44.0% of products labelled 1K+ bought in past month, so it is a large competitor in busy niches even when it looks small by count.
- Build outlier rules into any price report. A few placeholder prices in the thousands can distort an average, which is one reason this study reports medians.
If you plan to track these signals over time, our price scraping guide for e-commerce covers the basics, and Amazon repricing and MAP monitoring covers what brands do with offer data. For collecting marketplace data in general, see scraping Amazon and eBay marketplace data.
Method and Caveats
How we got these numbers. On 23 to 24 September 2026 we used Scrapewise to collect public amazon.co.uk search results for 868 everyday shopping keywords. The keywords cover 16 categories: beauty, health, home, kitchen, tools, garden, pets, toys, baby, office, sport, camping, electronics, car, crafts and music, and fashion and travel. We captured up to 7 result pages per keyword, which gave 197,022 unique products. For each product we recorded the price, star rating, review count, badges and the "bought in past month" label. We then read each product's offer listing and the public profile page of every seller we found, 55,660 sellers from a wider 1,068-keyword pass.
What it is not. This is a keyword-driven sample, not all of Amazon UK. It is one point in time, and prices, deals and badges change often. A seller's country is the business address the seller declares to Amazon, not where its stock sits. The "bought in past month" label is Amazon's own rounded figure, so we treat it as a minimum. Review counts above a thousand are shown rounded, and Amazon often pools reviews across variants of the same product. We capture about 11 sellers per product at most, so heavily contested products are undercounted. Sponsored flags cover only the ad slots our parser recognised, so the sponsored share is a minimum. All figures are medians or shares unless we say otherwise.
What we left out. We excluded the ratings on "Save X%" tiles, which our parser misread for a while. One large account is absent from the seller file; it sits on 14,923 products, and we left those products out of every seller-country figure. Review pooling across variants cannot be measured, so we make no claim about it. The story of what broke, and how we fixed it, is in how we scraped Amazon UK search results.
We publish aggregates only: no seller names, emails, phone numbers, addresses, company names, VAT numbers or seller IDs. For the legal background to collecting public prices, see our guide to EU price scraping law.
Data Definitions
These terms mean the same thing in every post of the series.
- Product: one unique Amazon listing (ASIN) found in the search results. The sample has 197,022.
- Priced product: a product that showed a price, 193,782 in total. Price figures use this base.
- Rated product: a product that showed a star rating, 182,700 in total. Star and review figures use this base.
- Product with offer data: a product whose offer listing we read, 196,376 in total. Seller counts per product use this base.
- Single-seller product: a product with exactly one seller on its offer listing, 141,582 in total.
- Seller profile: a public seller page, 55,660 in total. Rated sellers are the 51,374 profiles that show a feedback score.
- Seller-product link: one seller on one product's offer listing. We counted 394,727 links.
- Seller country: the country of the business address declared on the seller profile. We do not verify it.
- Label floor: the number in Amazon's "bought in past month" label, such as "1K+ bought in past month". It is a rounded minimum, so any total built from it is a lower bound.
- Median: the middle value. Half the products sit above it and half below. We use it instead of the mean because a few extreme prices would pull the mean far off.
- Price spread: the price at the dear end of a group (p90) divided by the price at the cheap end (p10).
- Same-search comparison: two groups compared inside each keyword first, then summarised as the median across keywords. It avoids comparing a phone case with a sofa.
- Sponsored listing: a search result our parser recognised as an ad. The count is a minimum.
All Posts in This Series
Sellers:
- Who sells on Amazon UK: sellers by country
- The largest sellers on Amazon UK
- What 100% positive seller feedback means
- Amazon UK seller VAT numbers
- How to reach an Amazon seller
- Amazon UK sellers by city and postcode
- UK vs Chinese sellers on Amazon
- Are Chinese sellers cheaper on Amazon
Categories and demand:
- Average price on Amazon UK by category
- Best selling categories on Amazon UK in 2026
- Most bought items on Amazon UK
- Amazon UK beauty market in numbers
- Amazon toy market in the UK
- Pet food on Amazon UK
- Amazon UK electronics prices
- Amazon fitness equipment prices in the UK
Ratings and reviews:
- What counts as a good Amazon rating
- Can you trust a 5-star Amazon rating
- Estimating Amazon sales from reviews
- Worst rated products on Amazon
Search, badges and ads:
- How to rank on page one of Amazon
- The Amazon's Choice badge explained
- Sponsored product prices on Amazon UK
- Amazon coupon average discount
- Amazon title length
Pricing psychology:
- Charm pricing and .99 endings on Amazon UK
- Price thresholds on Amazon UK
- Best price point to sell on Amazon UK
Competition:
- Buy box competition on Amazon UK
- Does Amazon compete with its own sellers
- Most competitive products on Amazon
- Same product, different price on Amazon
Seller offers:
- Price gaps between sellers on the same product
- FBA vs FBM on Amazon UK
- Who wins the featured offer on Amazon
- Amazon vs third-party prices on the same product
- How fast Amazon UK sellers deliver
- Used vs new offers on Amazon UK
Listings and method:
- Most expensive items on Amazon UK
- Cheapest things on Amazon UK
- How we scraped 197,022 Amazon UK products
How We Collected This Data
We ran three Scrapewise data APIs on amazon.co.uk, one after the other, each feeding the next.
First, the Amazon Search API ran on 868 keywords, pages 1 to 7. For each result it returned the position, price, star rating, review count, sponsored flag, "bought in past month" label, badges, coupon or deal text and title. That gave us the product list and every price, rating and search figure in this report.
Second, the Amazon Offers API read the offer listing of each product. It returned a row per offer with the seller, price, shipping, condition, ships-from and delivery details. From those rows we counted the sellers on each product and saw whether Amazon was one of them.
Third, the Amazon Seller API read the public profile of each seller from a wider 1,068-keyword pass. It returned the store name, about text, positive feedback score, rating count and business details, including the declared address. We publish only aggregates.
The three APIs share one price, €0.00015 per call, or €0.15 per 1,000 calls. Runs can be scheduled daily, every few days, weekly or monthly, or on demand, and the results come back through the REST API or as a CSV/Excel export. Make an account to run the same search, offer and seller chain on your own keywords.
Want this report for your own categories, refreshed when you choose? Every new account starts with 5 free requests, and you pay as you go after that. Sign up to Scrapewise or read pricing first.
Paste a marketplace URL — get structured market data
Size categories, track assortments, monitor trends. Clean feeds ready for your BI stack.
97% accuracy on Amazon benchmarks · no credit card · book a 15-min call →