
Key takeaways
- Among priced products, 854 sit at £99.xx and 88 at £100.xx, so there are 9.7x as many just below the £100 line as on it.
- The price gap grows with the threshold: 2.2x at £10, 2.9x at £20, 3.7x at £30, 4.8x at £50 and 9.7x at £100.
- Half of priced products (49.5%) end in .99, while whole-pound prices make up only 5.2%.
Price threshold psychology shows up clearly on Amazon UK: among priced products, 854 sit at £99.xx and only 88 at £100.xx, so there are almost 10 products just below the £100 line for each one on it. The count covers 193,782 priced products, collected from amazon.co.uk on 23 to 24 September 2026.
The Data
A price threshold is a round number that shoppers seem to treat as a line: £10, £20, £50, £100. If sellers ignored those lines, the pound just below a threshold and the pound just above it would hold roughly the same number of products. They do not.
| Threshold | Ratio, below vs at |
|---|---|
| £10 (£9.xx vs £10.xx) | 2.2x |
| £20 (£19.xx vs £20.xx) | 2.9x |
| £30 (£29.xx vs £30.xx) | 3.7x |
| £50 (£49.xx vs £50.xx) | 4.8x |
| £100 (£99.xx vs £100.xx) | 9.7x |
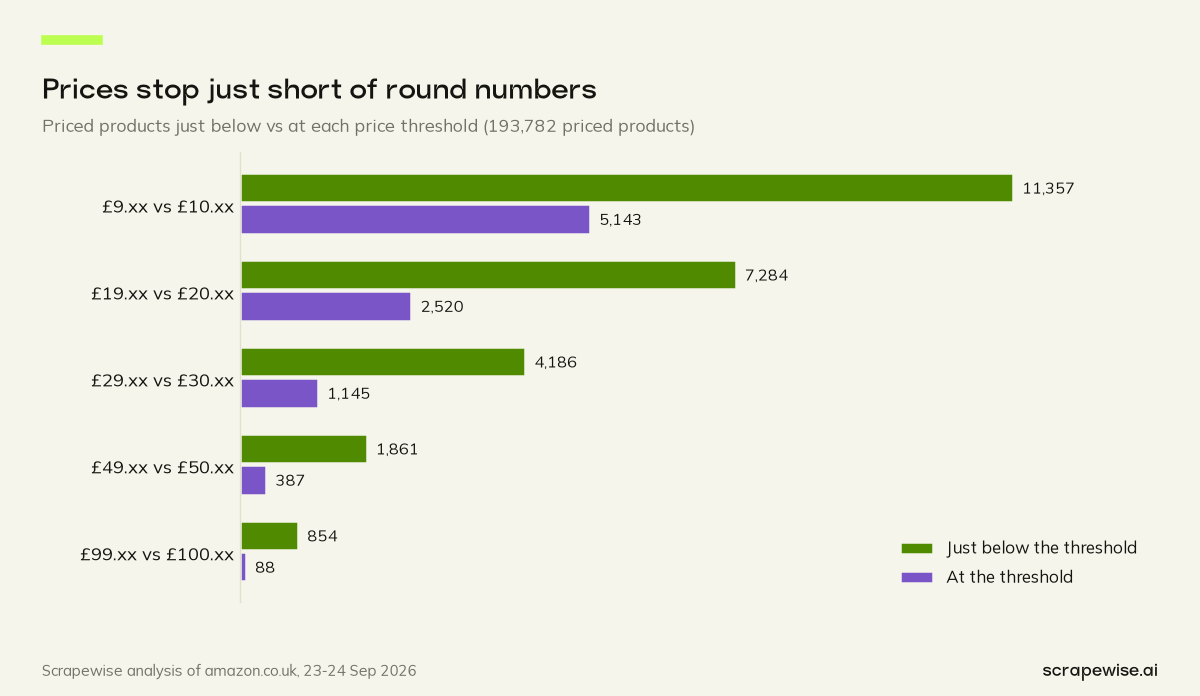
At £100 the imbalance is hard to miss: 854 priced products at £99.xx against 88 at £100.xx. Crossing into three digits, it seems, is a step most products would rather not take.
The Gap Grows With the Price
The ratio also changes from one threshold to the next. At £10 there are 2.2x as many products just below the line as on it. At £20 the ratio is 2.9x, at £30 it is 3.7x and at £50 it is 4.8x. At £100 it jumps to 9.7x. So the higher the price, the harder sellers seem to work to stay under the round number.
The usual explanation is the left digit. A shopper glancing at £99.99 reads "ninety-something", while any price starting with £100 reads "a hundred", and the jump from two digits to three makes the second price feel like a new category. The same logic applies at £10, but a move from £9.xx to £10.xx feels smaller in money terms, so sellers seem less anxious about it.
A second, more practical explanation is budgets. Many shoppers set a limit such as "under £50" or "under £100", in their heads or in a price filter. A product at £100.xx misses that budget by a penny, and a seller who knows it will price at £99.xx instead. Our data cannot separate the two explanations, but both push in the same direction.
Where .99 Endings Fit In
Thresholds are the big-picture version of a smaller habit: ending prices in .99. Half of the priced products in our sample, 49.5%, end in .99, while whole-pound prices, ending in .00, make up just 5.2%. The single most common price is £9.99.
The habit is not universal. Beauty is the category that uses the .99 ending least, at 36.8% of priced products, well below the market-wide half. Our full breakdown of endings, price points and who uses them is in psychological pricing on Amazon.
What It Means for Sellers and Brands
For sellers, the first lesson is that a threshold is crowded on one side. At £99.xx you are one of 854 products; at £100.xx you are one of 88. Pricing just under the line puts you where shoppers seem to look, but also where most of your competitors already sit. Pricing at the line is unusual. That can make a listing stand out, but our data cannot say whether it helps or hurts.
The second lesson is to test rather than assume. Our data shows what sellers do, not what shoppers buy. A snapshot cannot tell you whether the 854 products at £99.xx sell more than the 88 at £100.xx would at a penny more. If you are near a threshold, try both sides on your own listing for a few weeks and compare.
For brands with a recommended retail price, thresholds matter in price monitoring. A reseller who drops your product from £100.xx to £99.xx has made a small cut on paper and a large one in the shopper's mind. Tracking whether competitors cross a threshold is more useful than tracking every penny, and our guide on how to track competitor pricing strategies covers how to set that up.
For analysts, do not bucket prices into round bands that end exactly at £50 or £100 without care. The bands will look lopsided, because the market itself is lopsided at each threshold we measured. If you study what sells at which price, our post on the best price point to sell on Amazon UK looks at sales labels by price band, and the complete Amazon UK marketplace report has every other angle on this dataset.
How to Run a Threshold Check on Your Own Category
The same count works on any set of searches, and it needs nothing more than the price of each product:
- Collect the results pages for the keywords you sell in, with one price per product.
- Drop products without a price, and keep one row per product so a product that appears in several searches is counted once.
- For each threshold you care about, count the products in the pound just below it and in the pound starting at it.
- Divide the first count by the second. A ratio well above one means sellers are crowding under the line.
- Repeat the check on a schedule, and note when a competitor moves across a threshold in either direction.
Keep the pence. A spreadsheet that rounds prices to the nearest pound will conclude, with confidence, that this effect does not exist. Store prices as they appear on the page, and do the rounding, if any, at the very end.
It also helps to look at more than one threshold at once. A category where the ratio is high at £20 and low at £50 tells you where sellers feel price pressure, and where a product has more freedom to charge what it needs.
How We Collected This Data
This post rests on a single scraper, the Amazon Search API. Given 7 pages of results for each of our 868 amazon.co.uk keywords, it returned every product's price to the penny, along with its title and its position on the page. We kept the 193,782 products that showed a price and sorted them into one-pound bins. Each results page is one call, billed at €0.00015 per call (€0.15 per 1,000 calls), and the rows arrive through the REST API or a CSV/Excel export. Create an account to see where prices bunch in your own category.
Want to know which thresholds your competitors hide behind? Your first 5 free requests are enough to test it on one search, and after that you pay per call. Sign up and see pricing for the full rates.
Paste a marketplace URL — get structured market data
Size categories, track assortments, monitor trends. Clean feeds ready for your BI stack.
97% accuracy on Amazon benchmarks · no credit card · book a 15-min call →