
Key takeaways
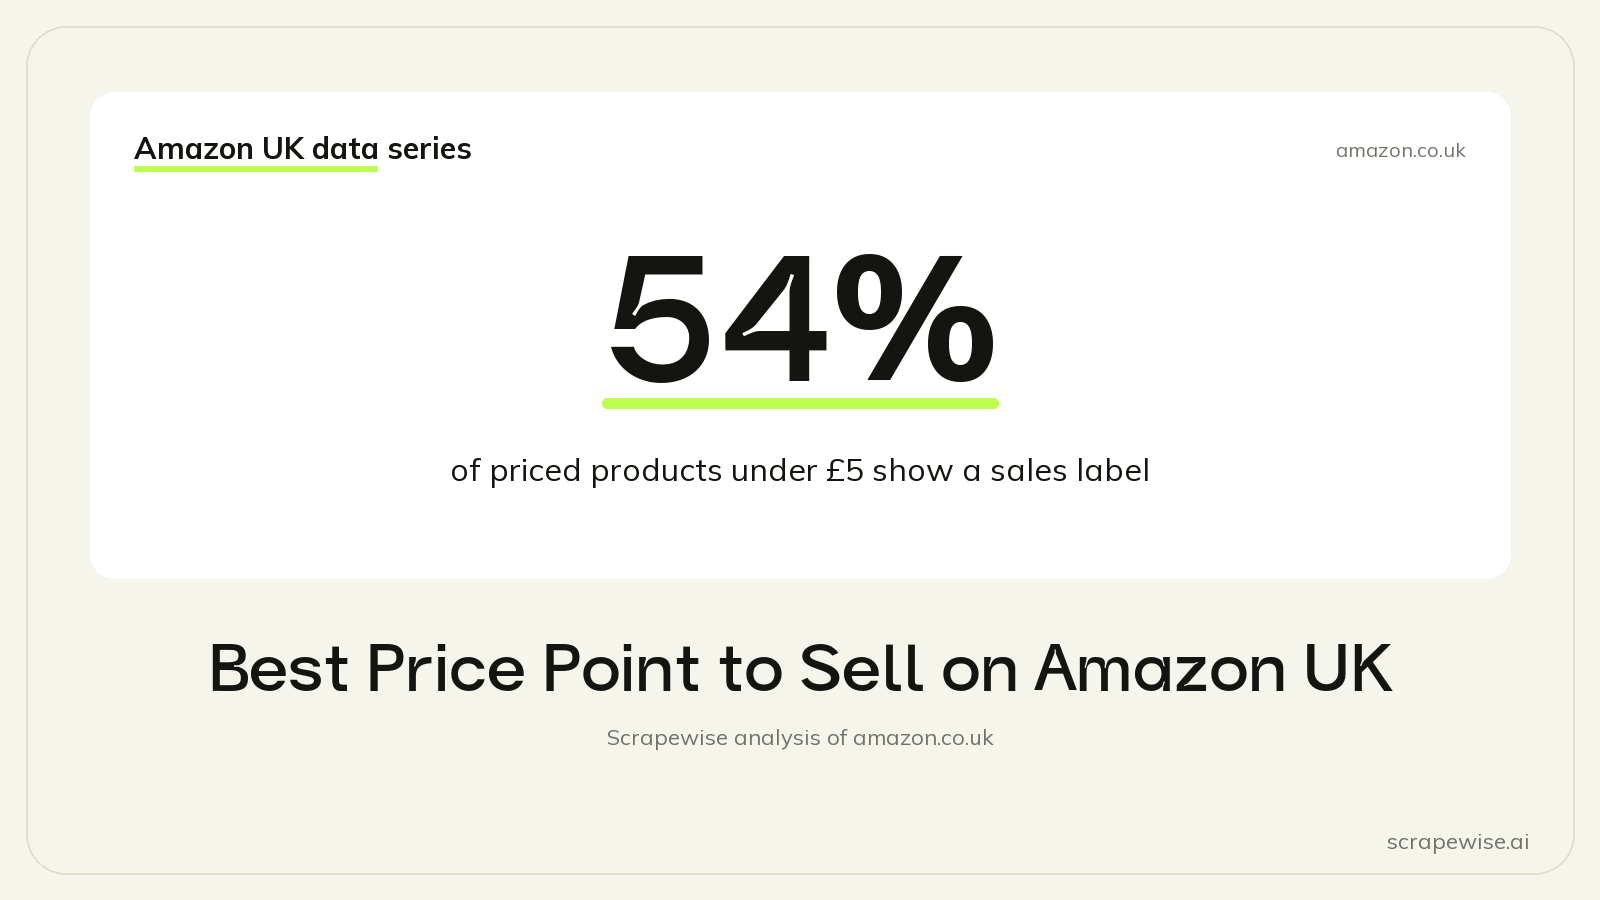
- 53.6% of priced products under £5 show a 'bought in past month' label, against 10.1% of priced products above £250.
- The labelled share falls with each step up the price ladder, from 46.5% at £5 to £10 down to 16.7% at £100 to £250.
- Products labelled 5K+ bought have a median price of £9.09, against £19.99 for priced products with no label.
The best price point to sell on Amazon UK, if you judge it by how often a listing shows a sales label, is under £5: 53.6% of priced products below £5 carry a "bought in past month" label, against 10.1% of those above £250. We checked 193,782 priced products in a snapshot of amazon.co.uk taken on 23 to 24 September 2026.
The Data
We grouped every priced product in the sample by its listed price and counted how many showed Amazon's "bought in past month" label. For reference, 36.6% of all 197,022 products show the label, priced or not. The bands below sit either side of that mark.
| Price band | Share with a sales label | Against 36.6% for all products |
|---|---|---|
| Under £5 | 53.6% | Well above |
| £5 to £10 | 46.5% | Above |
| £10 to £15 | 42.3% | Above |
| £15 to £20 | 39.2% | Slightly above |
| £20 to £30 | 34.0% | Slightly below |
| £30 to £50 | 27.1% | Below |
| £50 to £100 | 20.0% | Below |
| £100 to £250 | 16.7% | Well below |
| Above £250 | 10.1% | Well below |
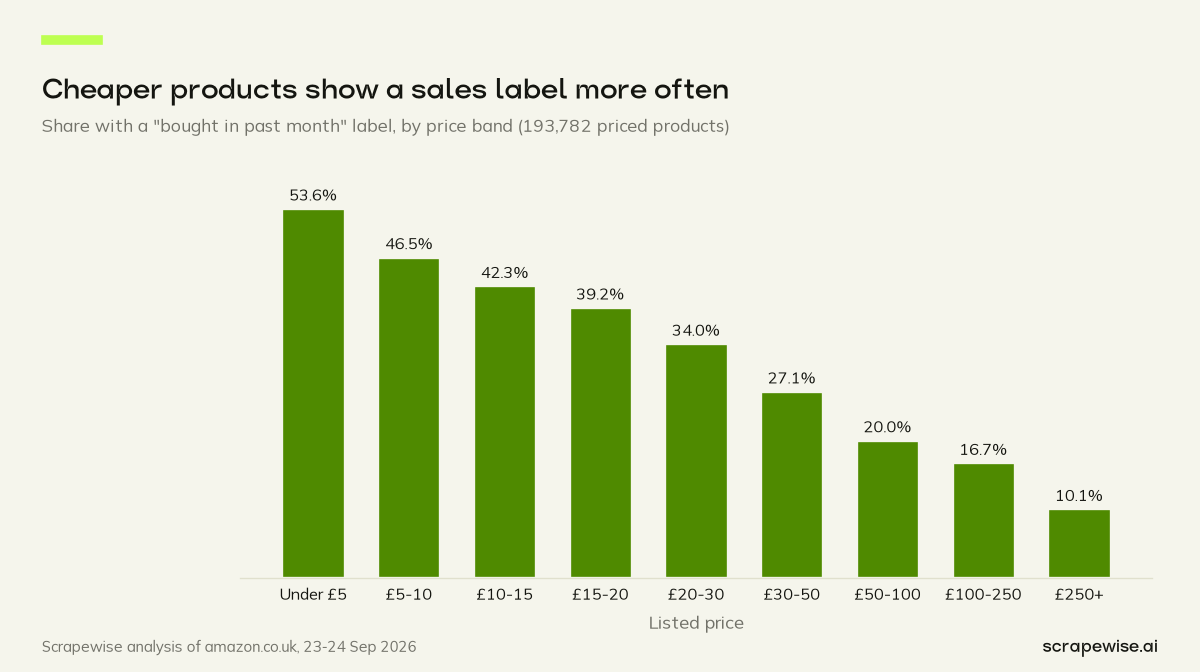
The line only goes one way. Each step up in price lowers the share of listings that show the label, and no band breaks the pattern. The steepest steps are from under £5 to £5 to £10, and between £20 and £100.
Why Cheap Products Show the Label More Often
The label counts units, not money. Amazon shows it only once a listing reaches the lowest step, "50+ bought in past month", and the steps above it are rounded too. A cheap product has an easier path to that first step than an expensive one.
The label is a rounded minimum, so it is the rare sales number that undersells itself. A listing labelled "1K+ bought" may have sold exactly that many units or a great deal more, and we treat every label as its floor.
The gap is widest at the top of the label ladder. Of priced products under £5, 11.2% show a "1K+ bought" label or higher. Across all products, priced or not, the share is 3.6%.
There are likely reasons the data cannot prove on its own. Many cheap products are consumables, which people buy again. Low prices also make impulse buys easier. The chart shows that price and the label move together. It does not show that a lower price causes more sales.
Where the Sweet Spot Sits
If the label is your measure, the numbers point at the bottom of the market. Products labelled 5K+ bought have a median price of £9.09. Priced products with no label at all have a median price of £19.99, above the median of £16.99 for every priced product in the sample.
That lines up with the most common price on the site. £9.99 is the single most used price point in our data, and half of all prices end in .99. We look at that habit in detail in our post on charm pricing on Amazon UK.
The top end behaves differently. Above £250, 10% of priced products show a label. That does not mean those products fail. A listing that sells a few dozen units a month at a high price can be a good business, and it would show no label at all.
Round numbers matter as well. Sellers steer clear of prices that start with £100: in our sample there are 9.7x as many priced products at £99-something as at £100-something. The pattern and the smaller jumps below it are in our post on price threshold psychology. For typical prices by category, see the average price on Amazon UK.
What This Data Cannot Tell You
A few limits matter before you reprice anything. The label sits on the listing, not on the seller, so a listing with several sellers shares one label between them. Variants such as sizes and colours can share a listing too, which may lift the label for products sold in many versions.
The sample is keyword-driven. We searched 868 terms and read the first seven pages of results, so products that never rank for those terms are missing. Search results also lean towards products that already sell, which means the true share of unlabelled products across the whole site is likely higher than ours.
The snapshot is one moment. A seasonal product can show a strong label in its season and none a few months later. September is neither the Christmas peak nor the January lull, but it is still one month.
Finally, price here is the price shown in search results on the day we collected it. A product can change price, or gain a coupon, the next morning, so treat each band as a snapshot rather than a fixed rule.
What It Means for Sellers and Brands
Volume and profit are different goals. The under £5 band wins on visible sales signals, but a very cheap product needs many units to cover fees and shipping. Use the label data to judge demand at a price, then run your own margin numbers.
Expect weaker social proof at higher prices. A premium product will rarely show a sales label, so shoppers lean more on reviews, ratings and images. Brands selling above £50 should plan for that rather than chase a label they are unlikely to get.
Watch the bands your competitors sit in. If most rivals in your search cluster between £10 and £15, a listing priced in the £20 to £30 band sits where fewer products show the label. That can be a deliberate premium choice, which is fine, as long as somebody actually chose it. Our guide on how to track competitor pricing covers the routine.
Read the label as a floor. Two listings with the same "100+ bought" label can differ a lot in real volume.
The full set of price, rating and seller numbers is in our Amazon UK marketplace statistics report.
How We Collected This Data
One scraper did all the work here, the Amazon Search API. We gave it the first seven results pages of 868 searches on amazon.co.uk. For each result it sent back the listed price and the "bought in past month" label, and that was all this post needed: we sorted the prices into bands and counted the labels in each. The same rows also hold the title, rating, review count and sponsored flag.
The Amazon Search API costs €0.00015 per call, or €0.15 per 1,000 calls. You can run it daily, every few days, weekly or monthly, or on demand, and get the results through the REST API or a CSV/Excel export. Create an account to run it on the searches in your own category.
Wondering where your own price sits in the searches you sell in? Your first 5 free requests will show you, and after that you pay as you go. Sign up here or compare pricing.
Paste a marketplace URL — get structured market data
Size categories, track assortments, monitor trends. Clean feeds ready for your BI stack.
97% accuracy on Amazon benchmarks · no credit card · book a 15-min call →