
Key takeaways
- Beauty led our sample with at least 6.7 million units a month, from Amazon's rounded sales labels.
- 58% of beauty listings carried a sales label, against 20% in Sports & Fitness.
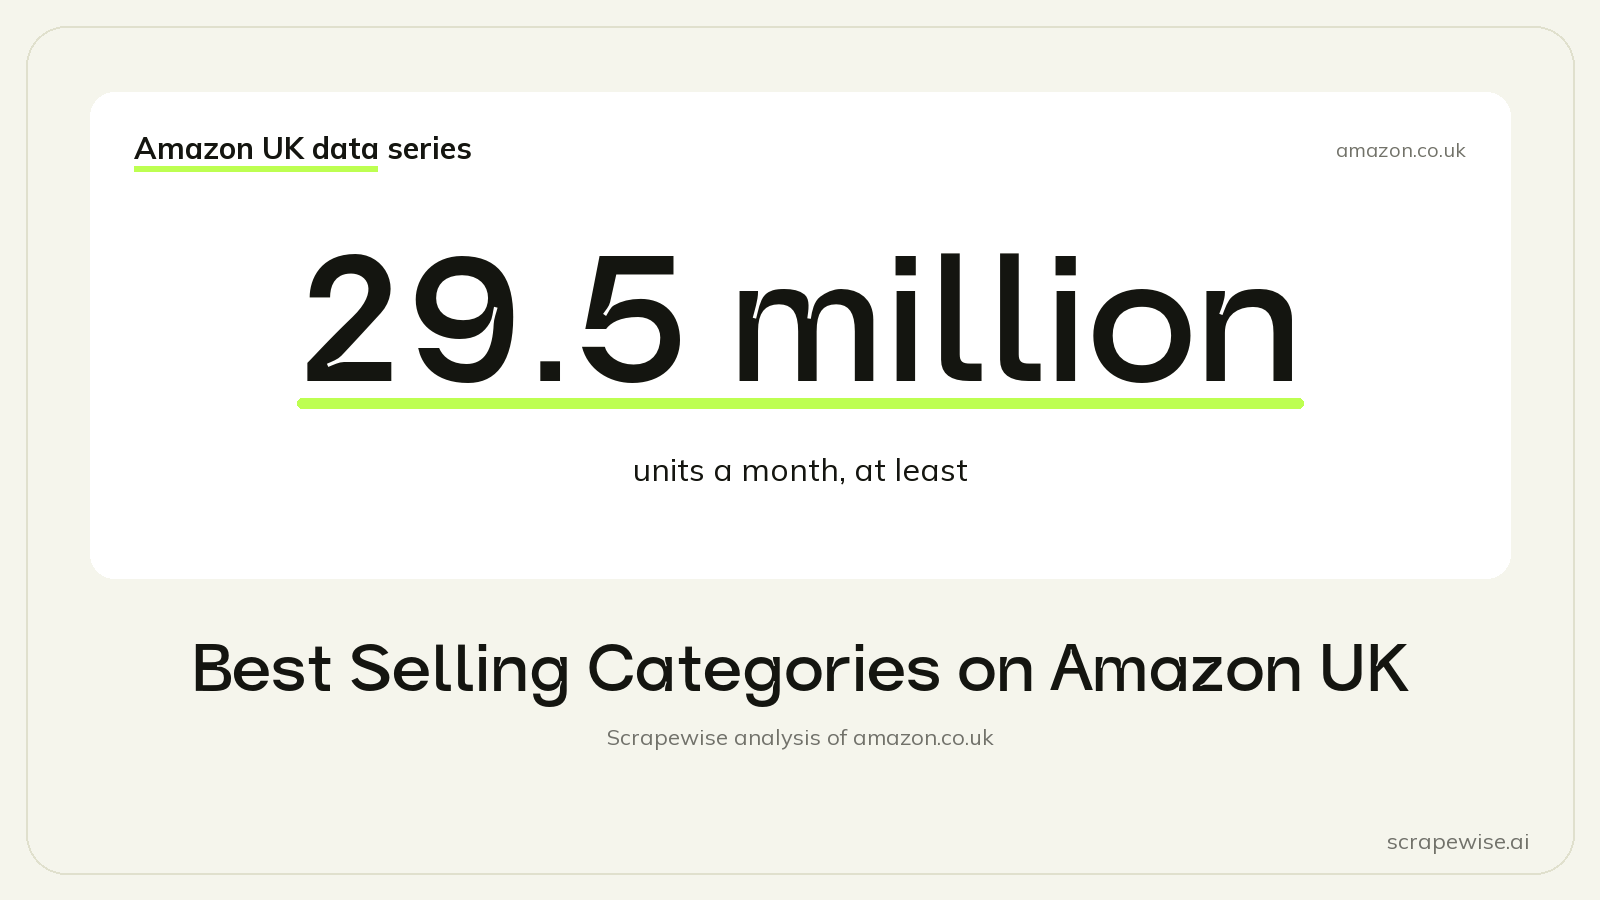
- Across our 197,022 products, the label floors add up to at least 29.5 million units a month.
Beauty and Personal Care is the best selling category on Amazon UK in our sample, with at least 6.7 million units a month and 58% of its listings showing a sales label, out of at least 29.5 million units a month overall. The figures add up Amazon's own sales labels from amazon.co.uk search results on 23 to 24 September 2026.
Units Sold per Month by Category
Amazon does not publish sales by category. It does show a "bought in past month" label on many search results, such as "50+ bought in past month" or "1K+ bought in past month". We added up the lower edge of every label we saw, per category. The result is a floor: the true figure can only be higher. The table shows the six largest floors and the smallest one.
| Category | Units sold per month, at least |
|---|---|
| Beauty & Personal Care | 6.7 million |
| Home & Cleaning | 4.21 million |
| Health & Supplements | 3.03 million |
| Electronics & Computing | 2.55 million |
| Kitchen & Dining | 2.46 million |
| Pets | 2.43 million |
| Camping & Fishing | 0.22 million |
| All categories in our sample | 29.5 million |
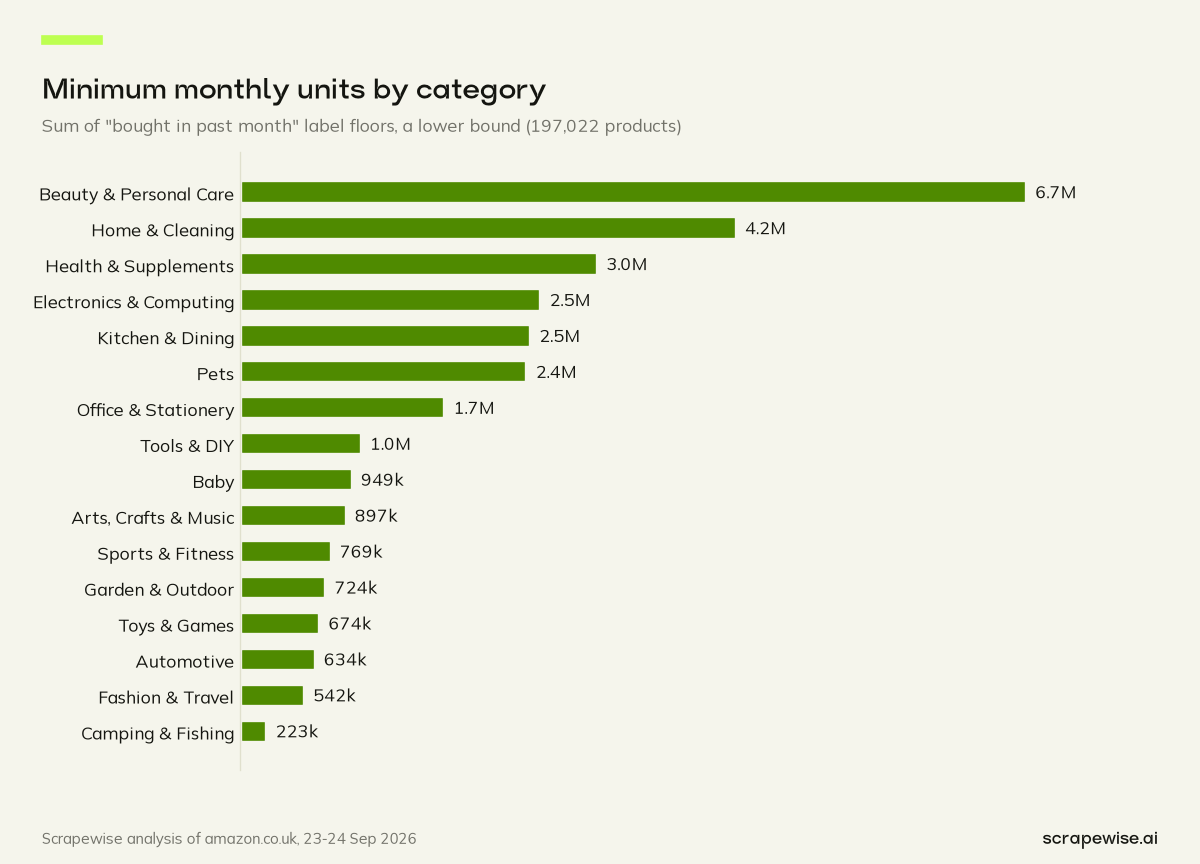
Beauty is ahead by a clear margin. Home & Cleaning comes second on volume, and Camping & Fishing sits at the bottom with at least 0.22 million units a month. Each label is a minimum, so this is a rare sales estimate that errs on the modest side.
How We Turned Labels Into Units
The method is simple, and its limits matter more than its result.
- A product labelled "1K+ bought in past month" counts at the bottom of that band, even if it sold many times more.
- A product with no label counts as zero. Many of them still sell; Amazon just does not say so.
- Each product counts once, in the category of the keyword where we found it. We mapped the 868 keywords to 16 categories.
In total, 72,071 products in our sample carried a label. Adding up 72,071 sales labels is not a job anyone should do in a spreadsheet, and we did not.
One more caveat. The sample is keyword-driven, so a category's total also depends on how many of our keywords fell into it. Home & Cleaning has many everyday keywords, which helps its volume. That is why the share of labelled listings, below, is often the fairer way to compare categories.
Which Categories Sell Broadly
Volume tells you where the units are. Label share tells you how many listings in a category sell at all. Across the whole sample, 36.6% of products carried a sales label.
| Category | Listings with a sales label |
|---|---|
| Beauty & Personal Care | 58% |
| Electronics & Computing | 51.3% |
| Health & Supplements | 48.8% |
| Office & Stationery | 48.1% |
| Home & Cleaning | 43.5% |
| Pets | 42.8% |
| Garden & Outdoor | 26.0% |
| Camping & Fishing | 25.8% |
| Sports & Fitness | 20% |
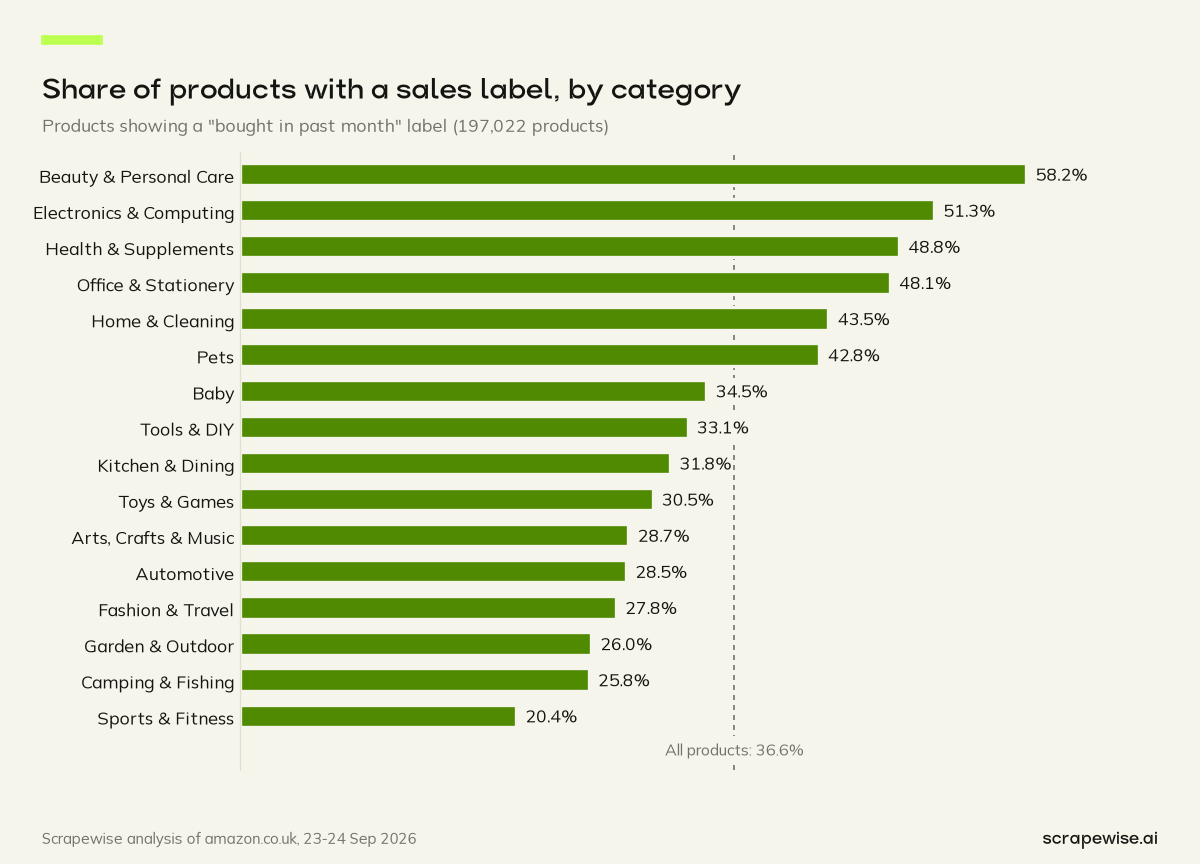
Beauty sells broadly and deeply. Most of its listings carry a label, and 11.4% of them reach "1K+" or higher, against 3.6% across the sample. Much of beauty is repeat purchase: shampoo, deodorant and moisturiser run out and get bought again. Our Amazon UK beauty market post goes deeper.
Electronics has depth without the biggest total. 51.3% of electronics listings are labelled and 9.5% reach "1K+", the second highest rate. Its volume floor is lower than Home & Cleaning's because our sample holds fewer electronics products, not because each one sells less.
Sports & Fitness is a long tail. Only 20% of its listings show a label, the lowest share of any category, and just 0.9% reach "1K+". Garden and Camping have similar label shares.
Category totals hide which single searches do the heavy lifting. That ranking is in our list of the most bought items on Amazon UK.
Why One Snapshot Can Mislead
The labels describe the month before our snapshot, which was taken in late September. That matters for seasonal categories. Garden & Outdoor and Camping & Fishing both sit near the bottom on label share, and part of that may be timing: summer demand for tents and paddling pools has faded by then. A snapshot taken in May could rank them higher.
Beauty, Health & Supplements and Pets should be steadier. People buy shampoo, vitamins and pet food all year, so their place in this ranking is less tied to the month we chose.
Kitchen & Dining shows another effect. It is one of the largest categories in our sample by product count, yet its floor of at least 2.46 million units is lower than Beauty's or Home's. One possible reason: many kitchen products may sell steadily but below the smallest label band, and a floor built from labels counts those as zero.
The fix for both problems is the same: repeat the snapshot. A monthly run on the same keywords turns a single floor into a trend, and a trend shows seasonality instead of hiding it.
What It Means for Sellers and Brands
If you are choosing a category, a high label share means buyers are active across many listings, which makes demand easier to prove before you commit stock. A low share, as in Sports & Fitness, means visible demand sits on fewer listings, so ranking matters more than being present.
Use the floors to compare categories with each other, not as a market size. A floor built from rounded labels says "at least this much", and the gap to the real number differs by category.
Labels change month to month, so one snapshot shows the shape of demand and repeated snapshots show how it moves. That is the same logic as competitor assortment gap analysis, applied to demand. Labelled products also tend to carry better ratings, as our guide to what is a good Amazon rating shows, and demand signals like these are one of the competitor data sources beyond price tracking that protect margins.
The other headline numbers from the same snapshot are in our Amazon UK marketplace statistics for 2026.
How We Collected This Data
Every label in this post was read by the Scrapewise Amazon Search API from pages 1 to 7 of each of 868 keywords. Next to the "bought in past month" label it returned the price, star rating, review count, title and page position of each product, and we mapped each keyword to one of 16 categories. The Amazon Best Sellers API was not used in this study; it reads Amazon's own bestseller rankings, which is a different view of demand. At €0.00015 per call, or €0.15 per 1,000 calls, a monthly repeat of the searches in one category is cheap to run. Set up an account to build label floors for the category you sell in.
Want to know how much your own category moves, at least? Run your first 5 free requests on its main searches. Create an account, and see pricing for monthly runs.
Paste a marketplace URL — get structured market data
Size categories, track assortments, monitor trends. Clean feeds ready for your BI stack.
97% accuracy on Amazon benchmarks · no credit card · book a 15-min call →