
Key takeaways
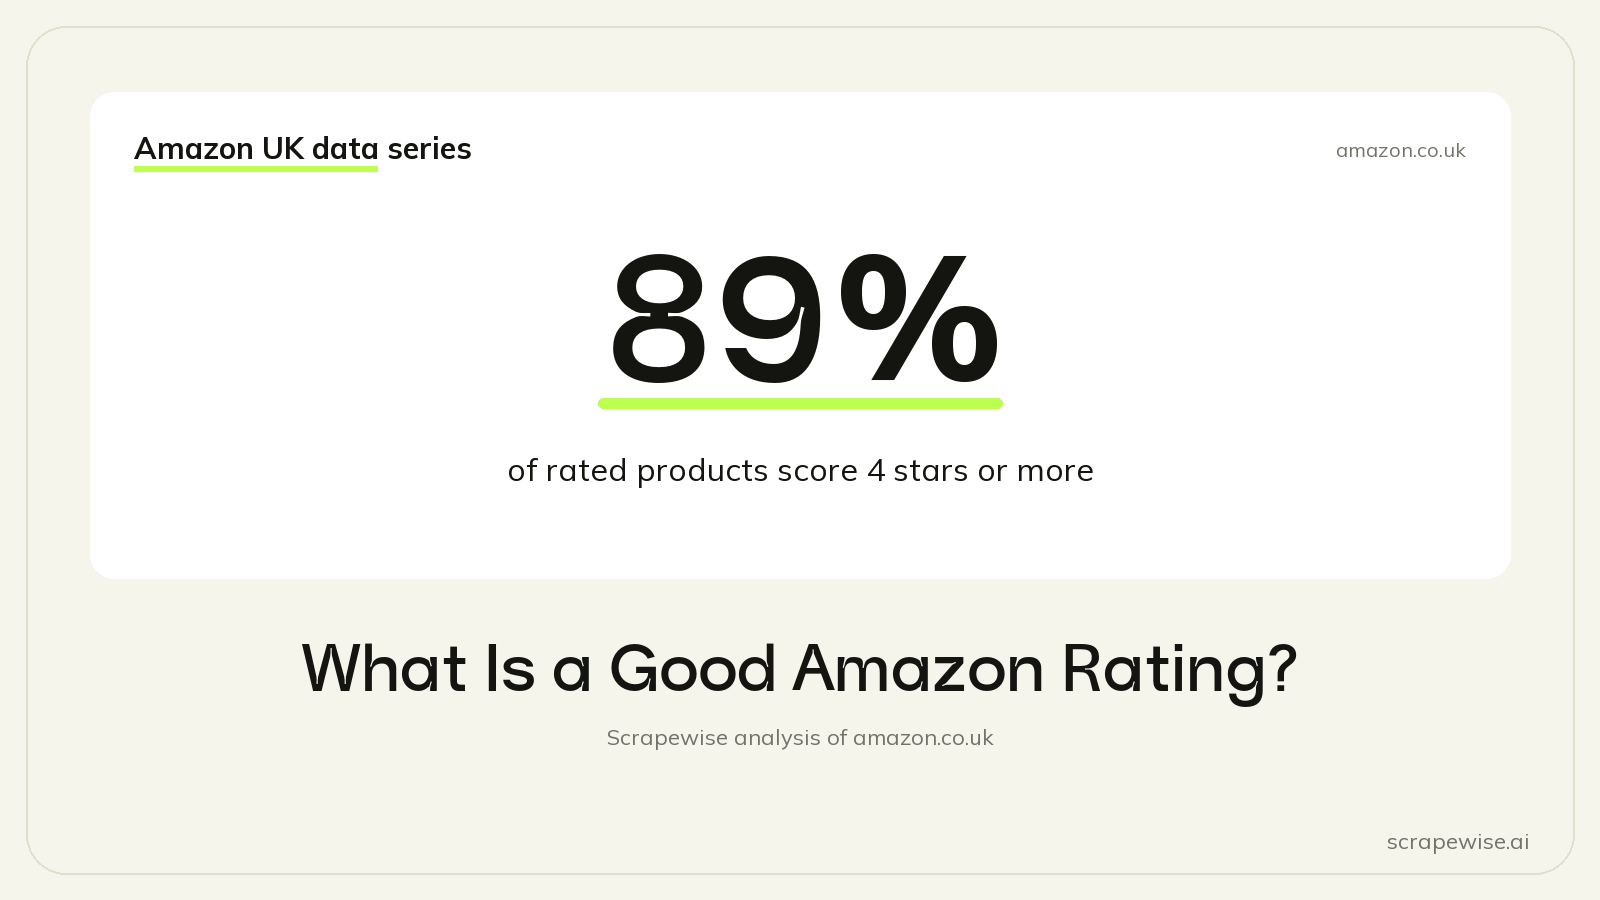
- 89% of 182,700 rated Amazon UK products score 4 stars or more.
- The median rated product scores 4.4 stars, so a 4.0 rating sits below the median.
- Rated products labelled 5K+ bought in past month have a median of 4.6 stars.
A good Amazon rating in the UK is 4.4 stars or higher: that is the median, and 89% of the 182,700 rated products in our sample score 4 stars or more. The ratings were read from amazon.co.uk search results on 23 to 24 September 2026. Products with the biggest sales labels score higher still.
How Amazon UK Star Ratings Are Spread
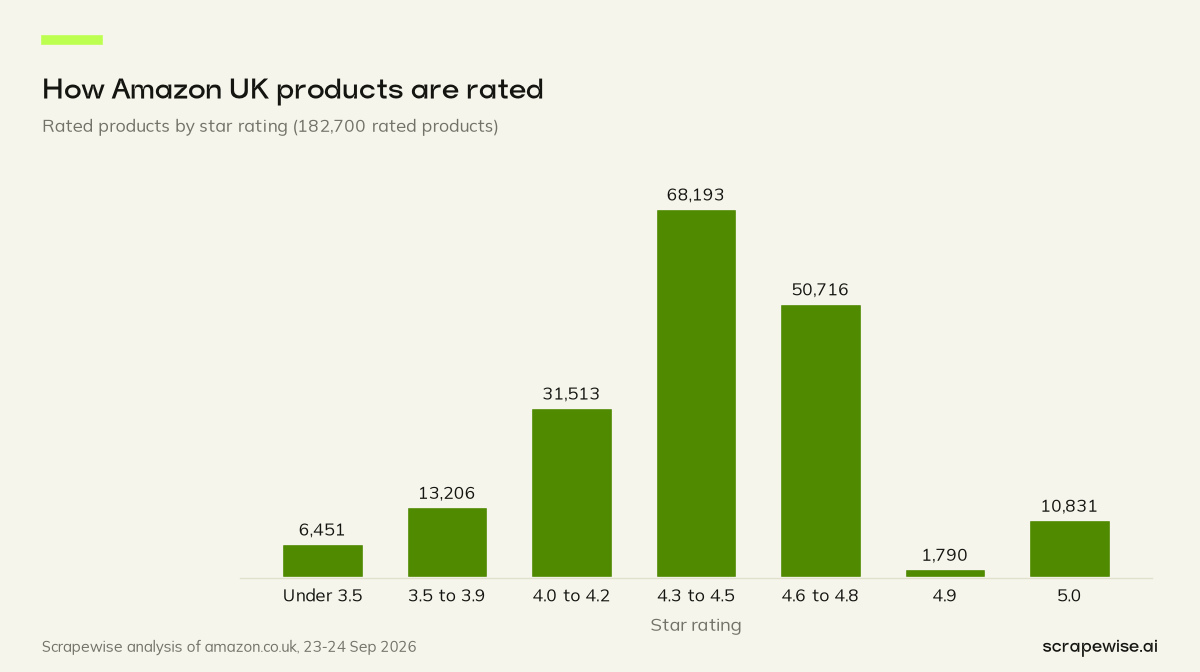
Most products on Amazon UK sit in a narrow band near the top of the scale. Of 182,700 rated products:
| Rating band | Share of rated products |
|---|---|
| 4.0 stars or more | 89% |
| 4.5 stars or more | 48.4% |
| Under 3.5 stars | 3.5% |
| Median rating | 4.4 stars |
The median is 4.4. On Amazon UK, 4 stars is below the median. The bottom of the scale is nearly empty: only 3.5% of rated products score under 3.5 stars.
If we include products with no rating at all, the share at 4.0 or more falls to 82.8% of all 197,022 products. Many unrated products may simply be new or slow-selling listings, so they pull the total down without saying much about quality.
So What Counts as a Good Rating?
Given how the ratings are spread, it helps to think in bands relative to the median rather than in absolute stars. A score that sounds high on a five-point scale can still be ordinary on Amazon UK, because almost everyone scores high.
- 4.5 stars or more is strong. 48.4% of rated products reach it, and it sits above the median.
- 4.4 stars is typical. It is the median itself.
- 4.0 to 4.3 stars is below the median. It is still positive, but a shopper comparing listings in one search will often see higher scores nearby.
- Under 3.5 stars is rare. Only 3.5% of rated products score this low, so such a score stands out next to almost any competitor.
Ratings Rise With Sales Labels
Amazon shows a "bought in past month" label on products above its sales thresholds. We grouped rated products by that label and measured the share with 4 stars or more in each group.
| Sales label | Share with 4+ stars (rated) |
|---|---|
| No label | 85.8% |
| 50+ bought | 91.6% |
| 100+ to 400+ bought | 95.0% |
| 500+ to 900+ bought | 97.3% |
| 1K+ to 4K+ bought | 98.4% |
| 5K+ bought | 99.1% |
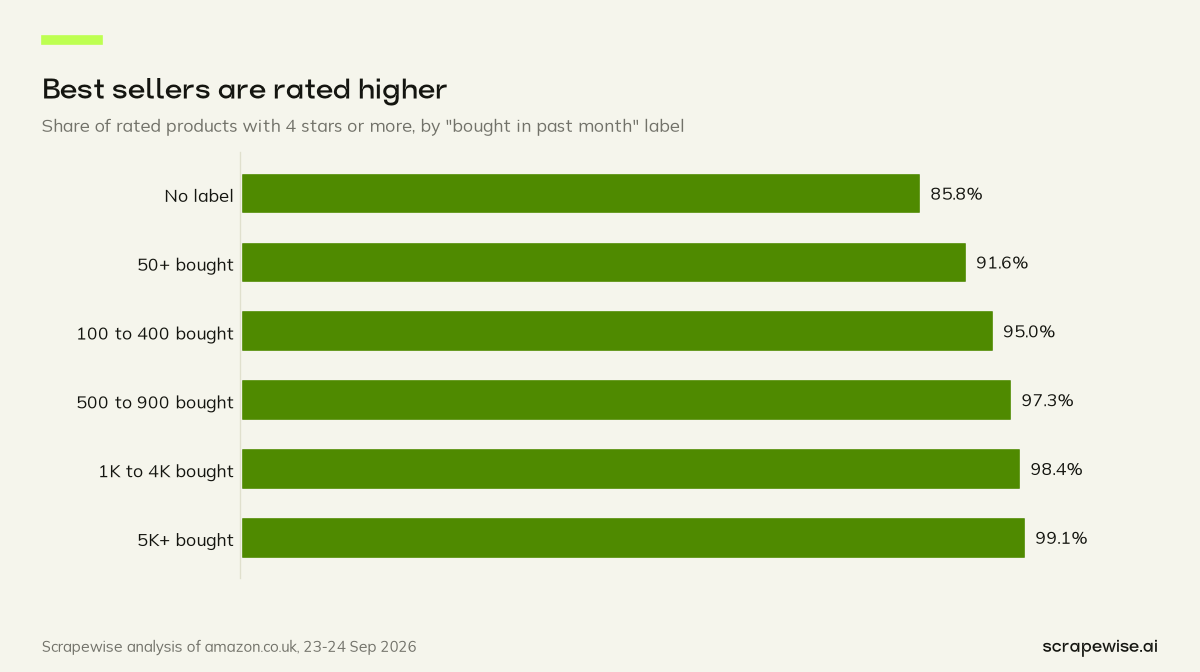
The top group is small. Rated products labelled 5K+ bought in past month have a median rating of 4.6 stars and a median of 6,800 reviews.
This is a correlation, not proof that ratings drive sales. It may run both ways. A well-rated product may sell more, and a product that sells more collects more reviews, which can steady its score. A snapshot cannot separate these effects.
Why a Perfect Score Deserves a Second Look
A 5.0 rating looks like the best possible result, but on Amazon UK it usually means very few reviews. The 10,831 products at exactly 5.0 have a median of 2 reviews. That is why the number of reviews matters as much as the score, and why we covered it separately in is 5 stars on Amazon trustworthy.
The same logic applies to sellers. A seller's feedback score is a different measure from a product's star rating, and it has its own quirks, which we look at in is perfect positive feedback on Amazon good.
Two Things That Blur the Picture
Star ratings look precise, but two habits of the site make them less exact than the decimal suggests.
The first is variant pooling. Amazon often shows one rating for a whole family of variants, such as every colour or size of the same product. A rating on a single listing can therefore carry reviews written about a different variant. Our data cannot measure how common that is, so we treat each rating as Amazon displays it.
The second is rounding. The score we read is the one shown in search results, rounded to one decimal place, and large review counts are also shown rounded. That is fine for comparing bands, and it is why we avoid claims finer than one decimal place.
Neither issue changes what the shopper sees. Pooled or not, the rating is the number shown next to the competitors, and it is the number that makes a 4.2 look weak or not.
How to Benchmark Your Own Rating
A marketplace-wide median is a starting point. The comparison that matters is with the products a shopper sees next to yours. A simple way to set it up:
- List the searches that matter. Use the keywords that bring you sales, plus a few where you want to appear.
- Collect the results pages. Record rating, review count and position for each product.
- Find the median rating per search. Your target is that median, not the marketplace figure of 4.4.
- Check again on a schedule. A monthly run is a reasonable start, and a sudden drop is worth catching early.
What It Means for Sellers and Brands
- Set the bar at 4.4, not 4.0. On Amazon UK a 4.0 product sits below the median, and shoppers compare it with the listings around it.
- Judge the rating in its search. Compare your score with the products in the same search, not with the whole marketplace.
- Read the review count next to the score. A 4.6 with thousands of reviews and a 5.0 with two are not the same signal.
- Notice small drops. A fall from 4.5 to 4.3 moves a product from above the median to below it. That is worth knowing the week it happens, not the quarter after.
For more on turning competitor data into margin decisions, see beyond price tracking.
How We Collected This Data
Both tables in this post rest on one Scrapewise data API, the Amazon Search API. It read the search results for our 868 keywords, pages 1 to 7, and for each product returned the star rating, the review count, the price, the page position and the "bought in past month" label. The Amazon Search API is priced at €0.00015 per call (€0.15 per 1,000 calls), with results delivered through the REST API or a CSV/Excel export. Register here to set your ratings against the products in your own searches.
The rest of the study, from price endings to seller countries, is in the Amazon UK Marketplace Report 2026.
Is your 4.3 above or below the median in your own search? A new account comes with 5 free requests, which is enough to find out for one keyword. Get started, or read pricing first.
Paste a marketplace URL — get structured market data
Size categories, track assortments, monitor trends. Clean feeds ready for your BI stack.
97% accuracy on Amazon benchmarks · no credit card · book a 15-min call →