
Key takeaways
- On single-seller listings, UK-based sellers hold 48.3% of Health and Supplements, their strongest category, but 12.5% of Arts, Crafts and Music.
- Of 636 searches we compared on single-seller listings, 403 have a majority from sellers based in China or Hong Kong.
- On single-seller listings, sellers based in China or Hong Kong hold 0.0% of whey protein and 0.9% of vitamin D3.
In the UK vs Chinese sellers question on Amazon, the category decides the answer: UK-based sellers hold 48.3% of single-seller listings in Health and Supplements, while sellers with a China address hold 59.7% in Office and Stationery and 59.5% in Arts, Crafts and Music. We checked single-seller listings in a snapshot of amazon.co.uk taken on 23 to 24 September 2026.
The Data
This post looks only at single-seller listings: products where one seller holds the listing, so the listing has one clear seller country. There are 141,582 of them in our sample. On each one, we took the seller's declared business address and grouped the results by category.
Two details shape the numbers. Listings where Amazon is the only seller count as their own group, Amazon, not as UK-based sellers. And we left out 14,923 products from one large account whose seller profile was missing from our seller file, because no seller country could be set for them. Multi-seller listings are out too, since one listing can carry sellers from several countries.
| Category | UK-based sellers' share |
|---|---|
| Health and Supplements | 48.3% |
| Garden and Outdoor | 39.3% |
| Home and Cleaning | 33.1% |
| Baby | 31.8% |
| Electronics and Computing | 14.5% |
| Arts, Crafts and Music | 12.5% |
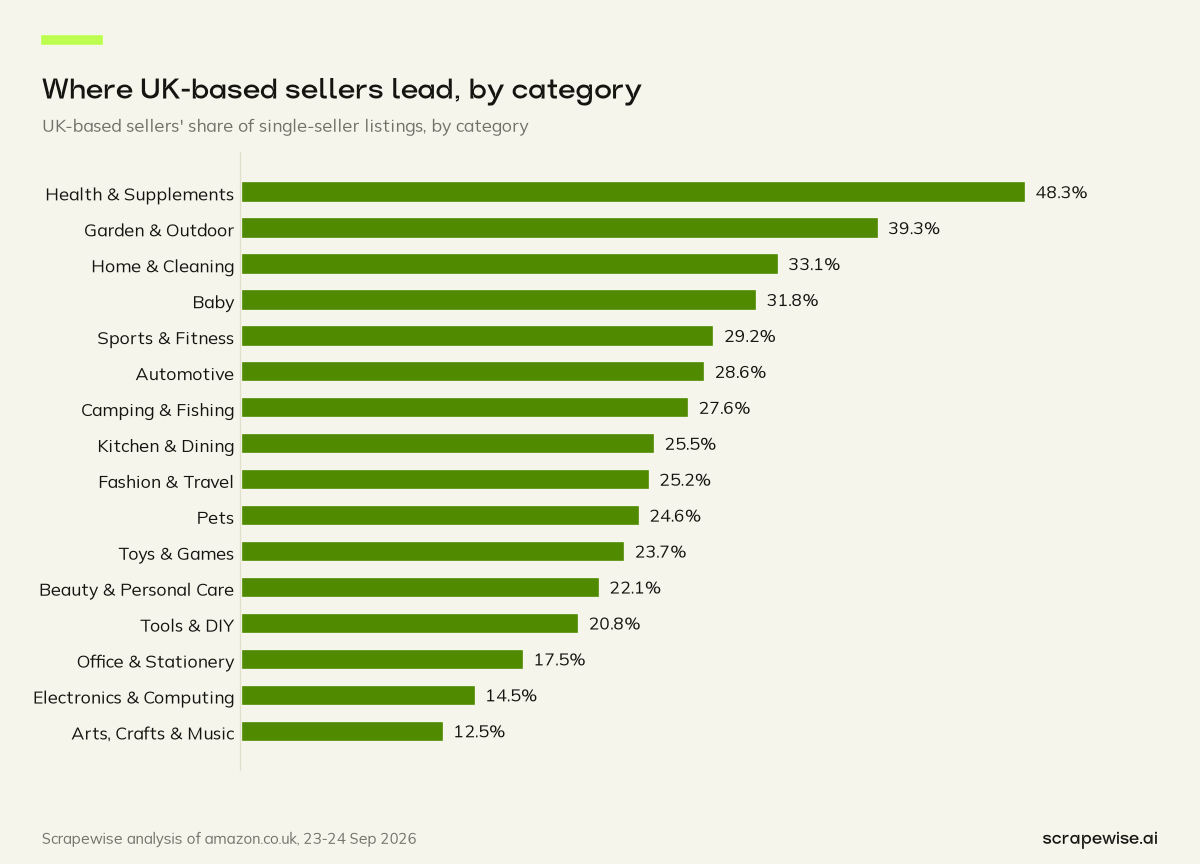
The spread is wide. In health, UK-based sellers hold 48.3% of single-seller listings. In crafts, they hold one listing in eight.
Where Sellers Based in China Lead
Sellers with a declared China address lead in categories full of small, standard goods. On single-seller listings they hold 59.7% of Office and Stationery, 59.5% of Arts, Crafts and Music and 55.4% of Electronics and Computing. In Health and Supplements, the same group holds 26.7%.
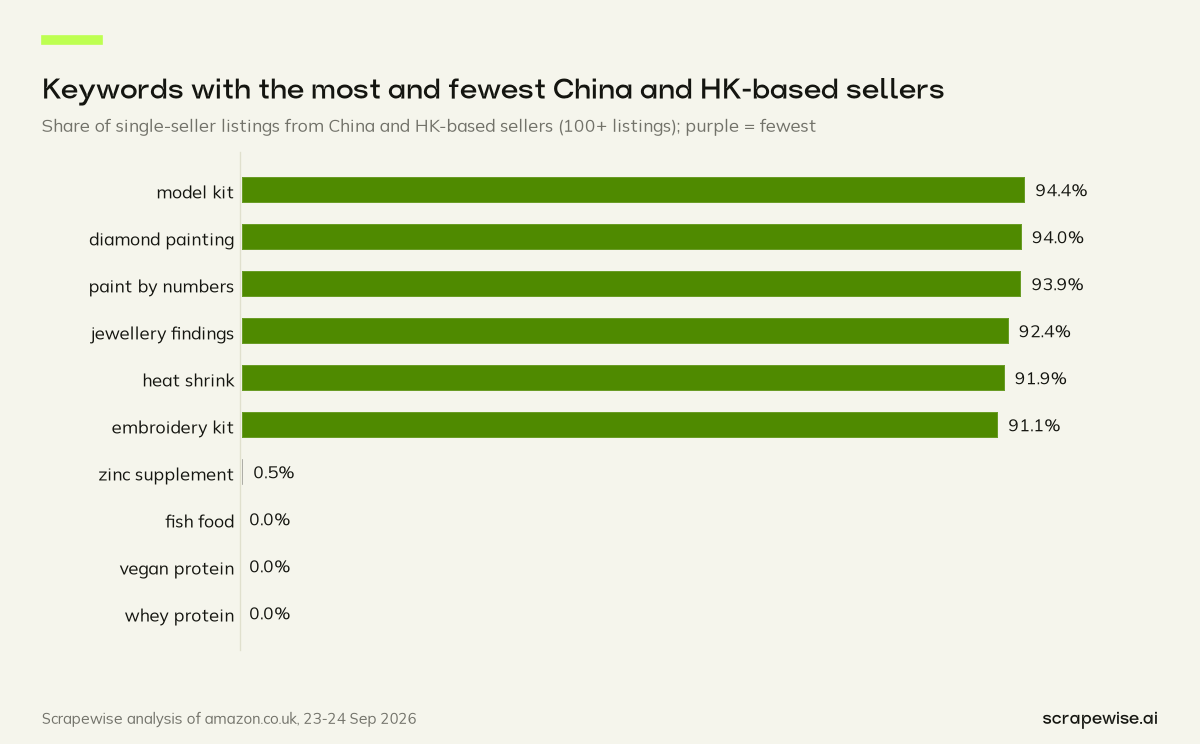
The pattern is stronger at keyword level. We compared 636 searches with enough single-seller listings to measure, and 403 of them have a majority of those listings held by sellers based in China or Hong Kong. The top of that list is hobby kits and small parts:
| Search keyword | Share held by sellers based in China or Hong Kong |
|---|---|
| model kit | 94.4% |
| diamond painting | 94.0% |
| paint by numbers | 93.9% |
| jewellery findings | 92.4% |
| heat shrink | 91.9% |
| embroidery kit | 91.1% |
These have something in common. One design often comes in many colours and sizes, and shoppers search for the product type rather than a brand name.
Where UK Sellers Lead: Health and Supplements
At the other end of the chart sit supplements. On single-seller listings, sellers based in China or Hong Kong hold 0.0% of whey protein, 0.0% of vegan protein, 0.5% of zinc supplements and 0.9% of vitamin D3. UK-based sellers hold 48.3% of the whole Health and Supplements category.
This is also a category that sells. 48.8% of health products show a "bought in past month" label, against 36.6% across the whole sample, and the category sold at least 3.03 million units a month. The median health product costs £16.69.
Vitamins carry a sales label on 96.6% of listings. Few products are bought quite so dutifully.
Why do supplements lean UK? Likely reasons include the rules on food supplement labelling, and the weight shoppers put on brands they recognise. The data shows the pattern, not which reason matters most. For how grey market sellers show up in regulated categories, see our guide to grey market monitoring.
Why the Country Totals Mislead
The headline seller count can mislead. Across every seller profile we collected, 55.5% declare a China address, and on single-seller listings as a whole, China-based sellers hold 49% of listings against 27.4% for UK-based sellers. Our post on Amazon UK sellers by country covers those totals.
Those totals hide two different markets. Sellers based in China or Hong Kong dominate hobby kits and small parts. UK-based sellers lead in supplements and hold far bigger shares in garden and home than in crafts. A seller deciding where to compete should start from the category and leave the national total aside.
Price does not divide them either. In a like-for-like test within the same keyword, sellers based in China or Hong Kong and UK-based sellers had median prices 3% apart. The full test is in our post asking are Chinese sellers cheaper on Amazon.
Country here always means the declared business address on the seller profile. It says where a business is registered. It does not say where a product was made, where it ships from or who owns the brand.
What It Means for Sellers and Brands
Know which market your category is. A UK brand in supplements competes mostly with other UK-based sellers. A UK seller of craft kits competes mostly with sellers based in China or Hong Kong. Pricing, sourcing and listing tactics that work in one may not carry over to the other.
Use keyword-level data before you launch. Category shares hide big swings: two searches in the same category can have very different seller mixes. A search where most listings come from one seller group tells you who sets the price level.
Brands in regulated categories should watch who else lists their products. A category with a clear seller profile makes unusual sellers easier to spot. Our guide to competitor assortment gap analysis shows how to map rivals by category.
Track the mix over time. A category where UK-based sellers hold a large share today can shift as new sellers arrive, and one snapshot cannot show the direction. Re-running the same searches every month shows whether a category is tilting.
Keep quality out of it. The data says nothing about product quality by seller country. It shows who holds which listings.
For the whole dataset, see our Amazon UK marketplace statistics report.
How We Collected This Data
Seller mix by category takes three steps, and each one is a Scrapewise scraper. The Amazon Search API went through 868 amazon.co.uk searches, seven results pages each, and returned every product with its keyword, price, rating and "bought in past month" label. The Amazon Offers API returned the sellers on each product, which is how we found the single-seller listings. The Amazon Seller API returned each seller's declared business address from the public profile; we publish only aggregates, never seller names.
All three cost €0.00015 per call, or €0.15 per 1,000 calls, and you can pull the results through the REST API or a CSV/Excel export. Create an account to map the seller mix in your own categories.
Want to know who holds the listings in your own searches? The first 5 free requests are enough to try it, and then you pay as you go. Sign up here or compare pricing.
Paste a marketplace URL — get structured market data
Size categories, track assortments, monitor trends. Clean feeds ready for your BI stack.
97% accuracy on Amazon benchmarks · no credit card · book a 15-min call →