
Key takeaways
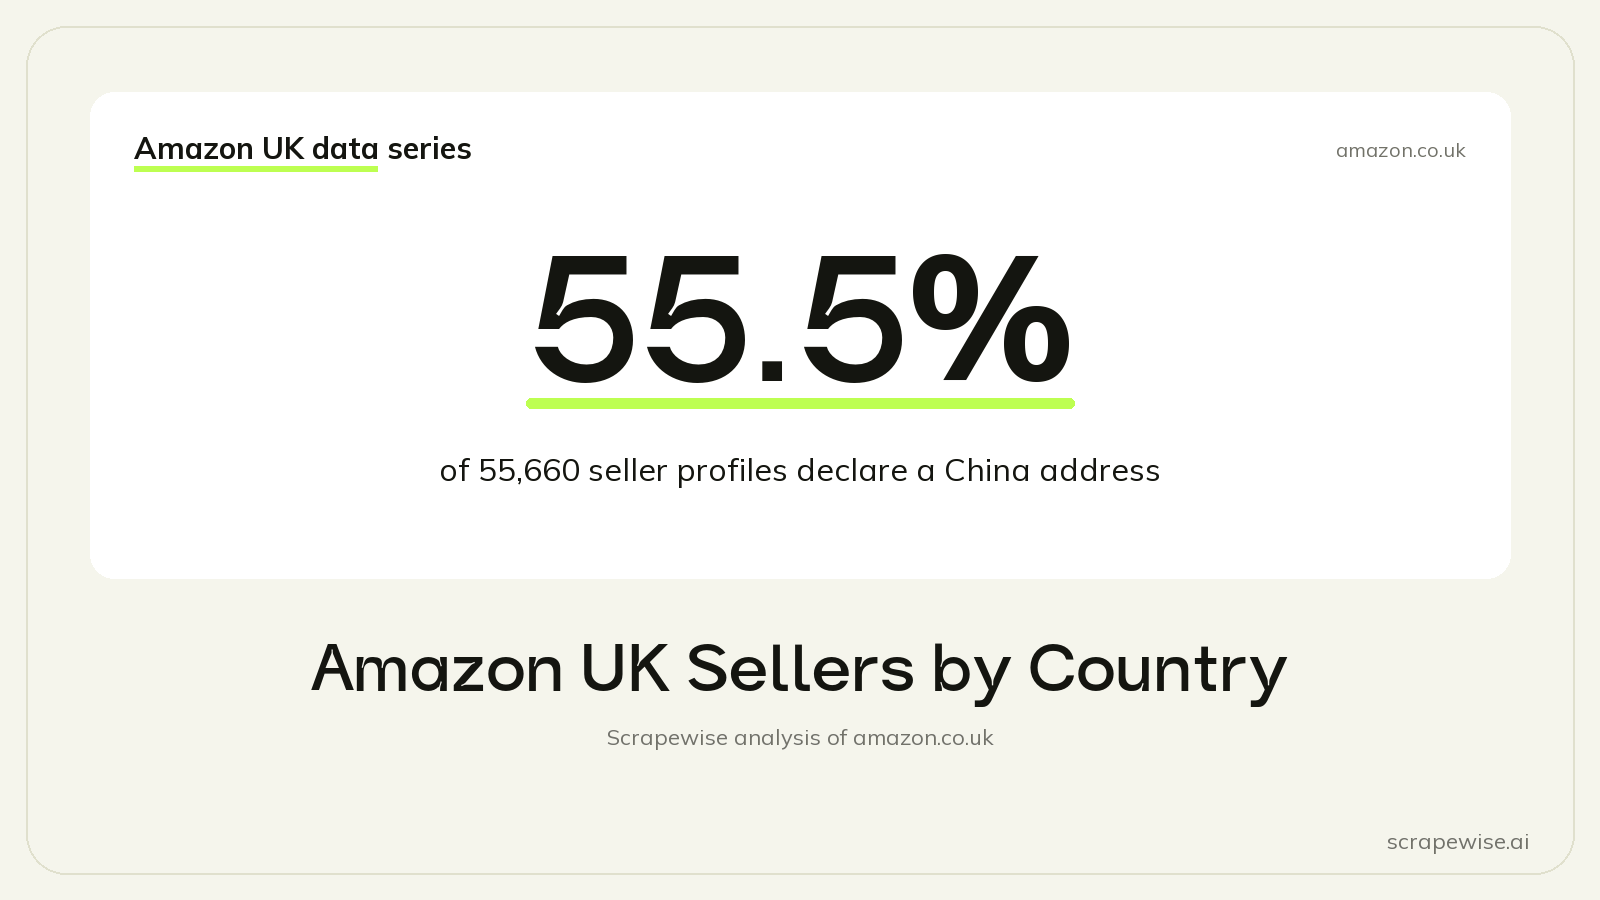
- 55.5% of 55,660 Amazon UK seller profiles declare a China business address and 29.2% a UK address.
- On single-seller listings, China-based sellers hold 48.7% of listings but 36.4% of the minimum unit volume.
- UK-based sellers hold 27.4% of single-seller listings and 31.1% of the minimum unit volume.
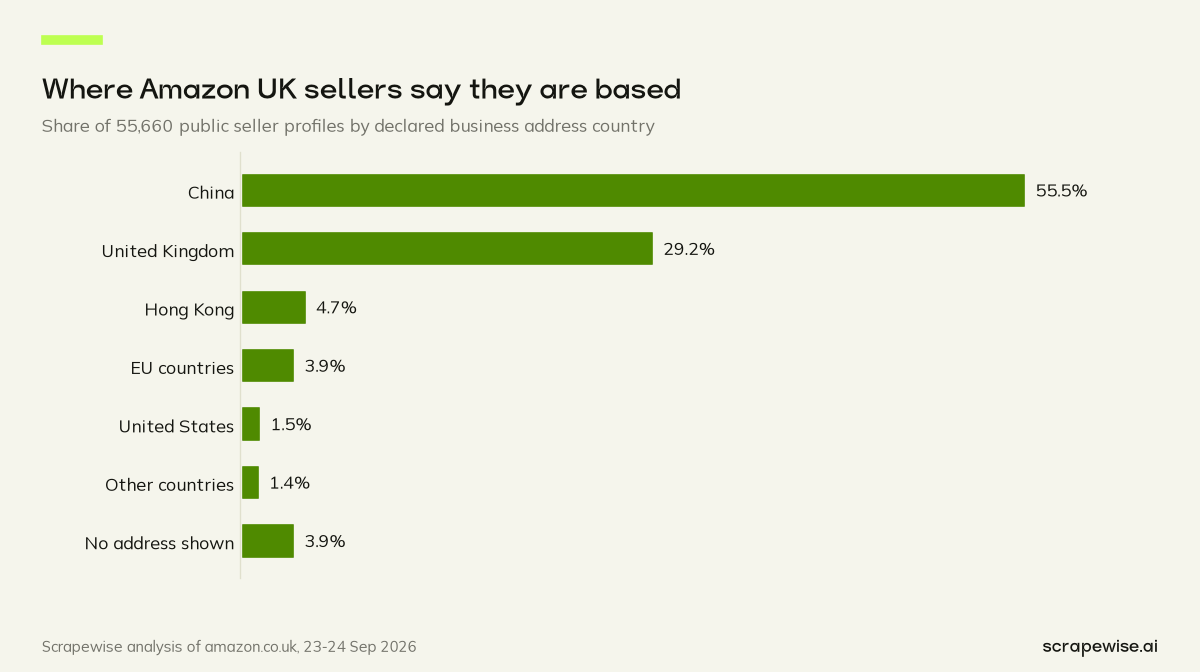
Of the 55,660 seller profiles we collected on Amazon UK, 55.5% declare a business address in China, 29.2% declare one in the United Kingdom and 4.7% in Hong Kong. We checked these public profiles in a snapshot of amazon.co.uk taken on 23 to 24 September 2026. A head count of sellers is only one measure, so we also compared listings and minimum sales volume.
Amazon UK Sellers by Country: The Headline Numbers
We read the public profile page of every third-party seller we found in our Amazon UK search results. Each profile has a "Detailed Seller Information" block, and most sellers fill in a business address there. We grouped the sellers by the country in that address.
| Declared business address | Sellers | Share of sellers |
|---|---|---|
| China | 30,882 | 55.5% |
| United Kingdom | 16,256 | 29.2% |
| Hong Kong | 2,596 | 4.7% |
| EU countries | 2,148 | 3.9% |
| United States | 824 | 1.5% |
| Other countries | - | 1.4% |
| No address shown | 2,166 | 3.9% |
China and Hong Kong together account for 60.1% of the seller profiles. EU countries add 3.9%, about the same as the group with no address on the profile.
A declared address tells you where the business says it is registered. It does not tell you where the stock is kept or how an order travels, so read the country as a fact about the business only.
Seller Counts vs Sales Volume
Counting sellers treats a one-product shop and a shop with thousands of products the same way. To get closer to market share, we looked at listings that have exactly one seller. On those products the seller is not in doubt, so each listing can be assigned to one country group. There were 141,582 such single-seller products in our sample.
For each of them we took two measures. The first is the share of listings. The second is the share of minimum monthly units, based on Amazon's own "bought in past month" label. That label is rounded down, so the unit figures are floors, not sales totals.
| Seller group | Share of single-seller listings | Share of minimum units |
|---|---|---|
| China | 48.7% | 36.4% |
| United Kingdom | 27.4% | 31.1% |
| Amazon | 7.5% | 18.1% |
| Hong Kong | 6.2% | 6.4% |
| EU countries | 2.7% | 2.2% |
| United States | 1.8% | 2.4% |
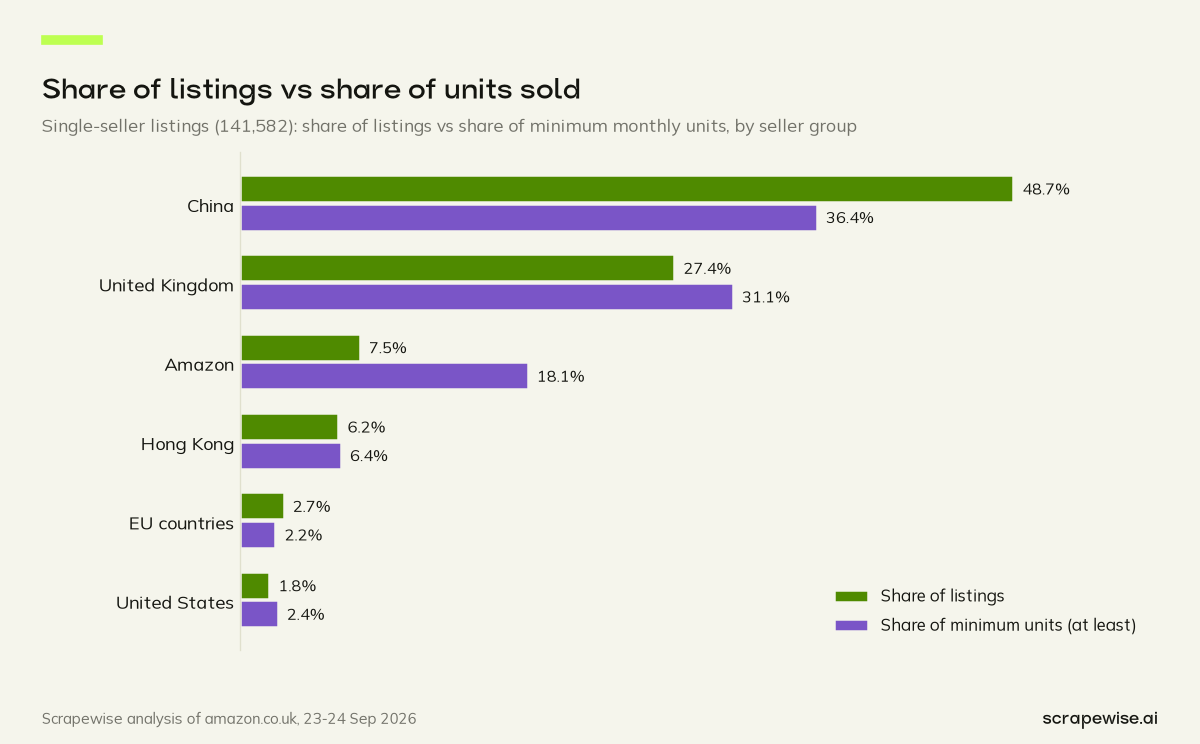
China-based sellers hold 49% of single-seller listings but 36% of the minimum units. Their listings show lower label bands, on the whole, than the listings of other groups. UK-based sellers move the other way: 27.4% of listings and 31.1% of units. Amazon's own single-seller listings are few, 7.5%, yet they carry 18.1% of the minimum units, so each Amazon listing tends to sit in a higher label band.
Hong Kong-based sellers sit close to balance, with 6.2% of listings and 6.4% of units. EU and US-based sellers are small groups on both measures.
The picture changes a lot by category, and a like-for-like price test tells a different story again. We cover the category split in UK vs Chinese sellers on Amazon by category, and prices within the same search in are Chinese sellers cheaper on Amazon.
What the Profiles Say About Business Type
Seller profiles also carry a business type field. Almost all sellers, 95.8% or 53,326 profiles, describe themselves as a privately owned business. Another 2,250 leave the field blank.
The rare answers are the more interesting ones. 67 sellers say they are publicly listed and 17 say they are state-owned. Next to 55,660 profiles in total they barely register, but they do exist.
How Far to Trust the Country Figures
Every number above comes with the same few limits.
First, the address is self-declared. We record what the profile says and do not verify it. 2,166 profiles, or 3.9%, show no address at all, and we keep them as their own group instead of guessing.
Second, the sample is keyword-driven. We found sellers through the products that appear in search results for everyday shopping keywords. A seller that lists only niche products outside those searches will not appear, so the shares describe the sellers a shopper meets in common searches.
Third, one large account is missing from the seller file. It sits on 14,923 products in our sample, and because we have no profile for it, we left those products out of every country figure. That is a gap in the country split, not in the product counts.
We do not publish names, addresses or any other details of individual sellers. Every figure in this post is an aggregate.
What It Means for Sellers and Brands
Seller country is useful context, but it is a poor shortcut for competition. A shop with one listing and a shop with thousands count the same in a seller tally. A few practical points follow from the numbers above.
- Look at listings and units as well as seller counts. A seller count favours groups with many small shops. The single-seller listing share and the unit share are closer to the competition a brand meets.
- Check your own categories. The seller mix in toys, beauty or electronics differs a lot from the marketplace total.
- Treat addresses as declared. The address is what the seller states to Amazon. It says nothing about product quality, stock location or delivery speed.
- Keep an eye on Amazon. It holds 7.5% of single-seller listings but 18.1% of the minimum units, so in a niche where it sells, it can be a large competitor with few listings.
If you source abroad or compete with sellers who do, costs can move with trade rules. Our guide to e-commerce price intelligence in the tariff era covers how to track that. For the wider question of collecting marketplace data, see scraping Amazon and eBay marketplace data.
How We Collected This Data
The data in this post came from three Scrapewise data APIs run on amazon.co.uk. The Amazon Search API covered 868 keywords, pages 1 to 7, and returned each product's price, rating, review count and "bought in past month" label. The Amazon Offers API returned the sellers on each product, which told us which listings have exactly one seller and whether Amazon is that seller. The Amazon Seller API returned each seller's public profile, including the declared business address and business type; we publish only aggregates. All three are priced the same: €0.00015 per call, which is €0.15 per 1,000 calls. Runs can be scheduled daily, every few days, weekly or monthly, or on demand, and the rows arrive through the REST API or as a CSV/Excel export. To build the same country table for your own categories, create an account.
The full study, with every finding and the method, is in the Amazon UK Marketplace Report 2026.
Curious where the sellers in your own niche are based? Your first 5 free requests are enough to test it on a few seller profiles. Open a Scrapewise account, and check pricing for what larger runs cost.
Paste a marketplace URL — get structured market data
Size categories, track assortments, monitor trends. Clean feeds ready for your BI stack.
97% accuracy on Amazon benchmarks · no credit card · book a 15-min call →