
Key takeaways
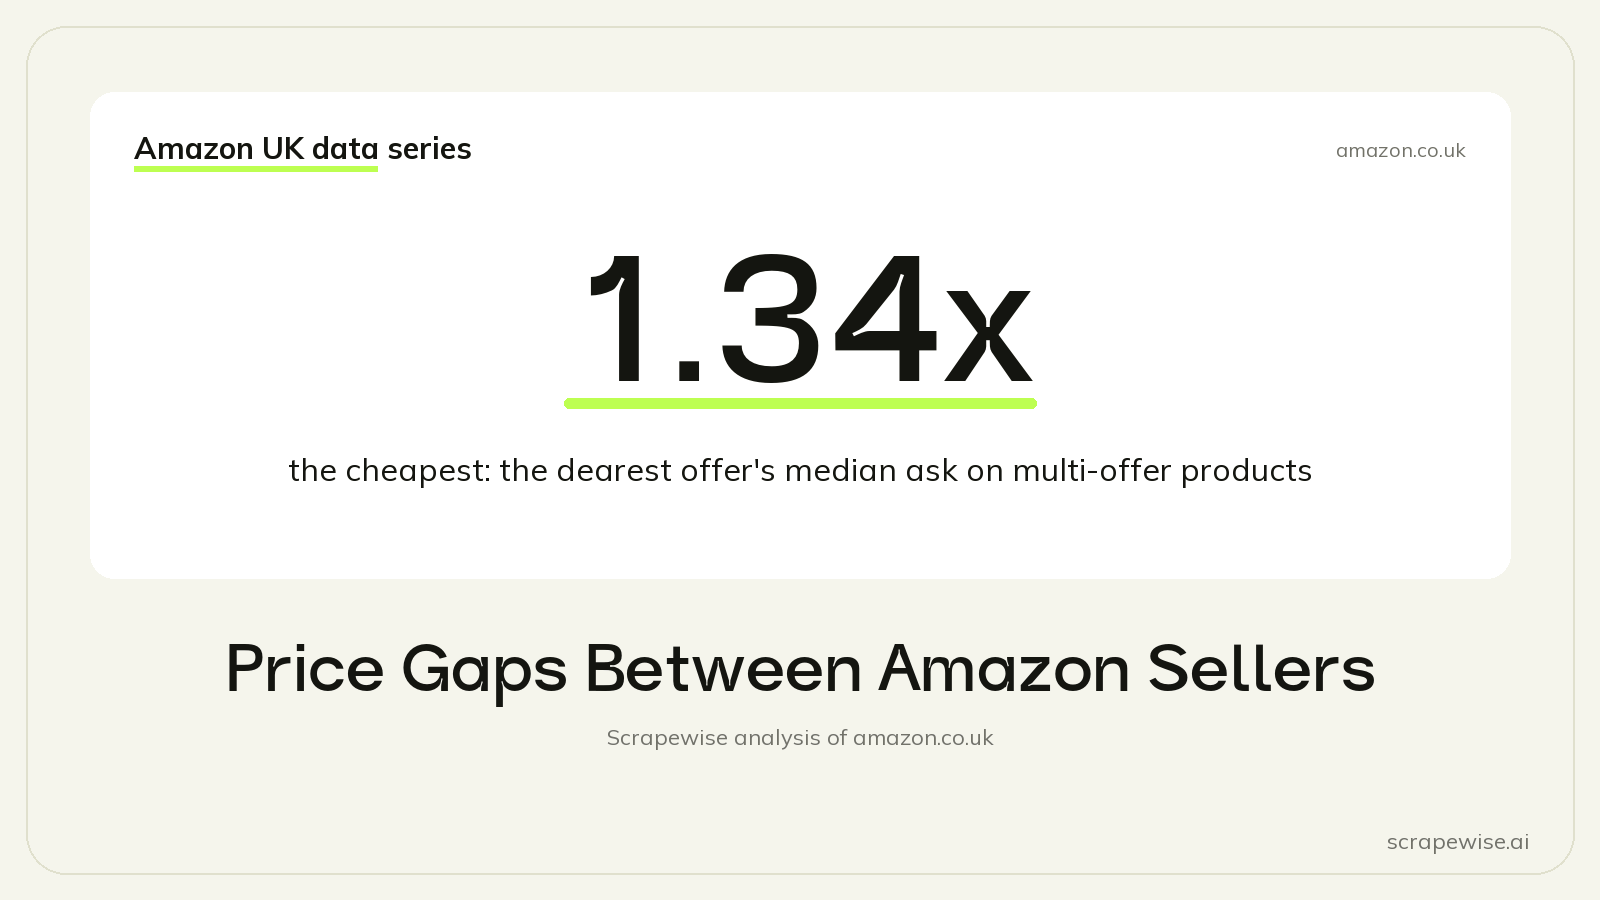
- On 68,851 multi-offer products, the dearest new offer asks a median 1.34x the cheapest, item plus shipping.
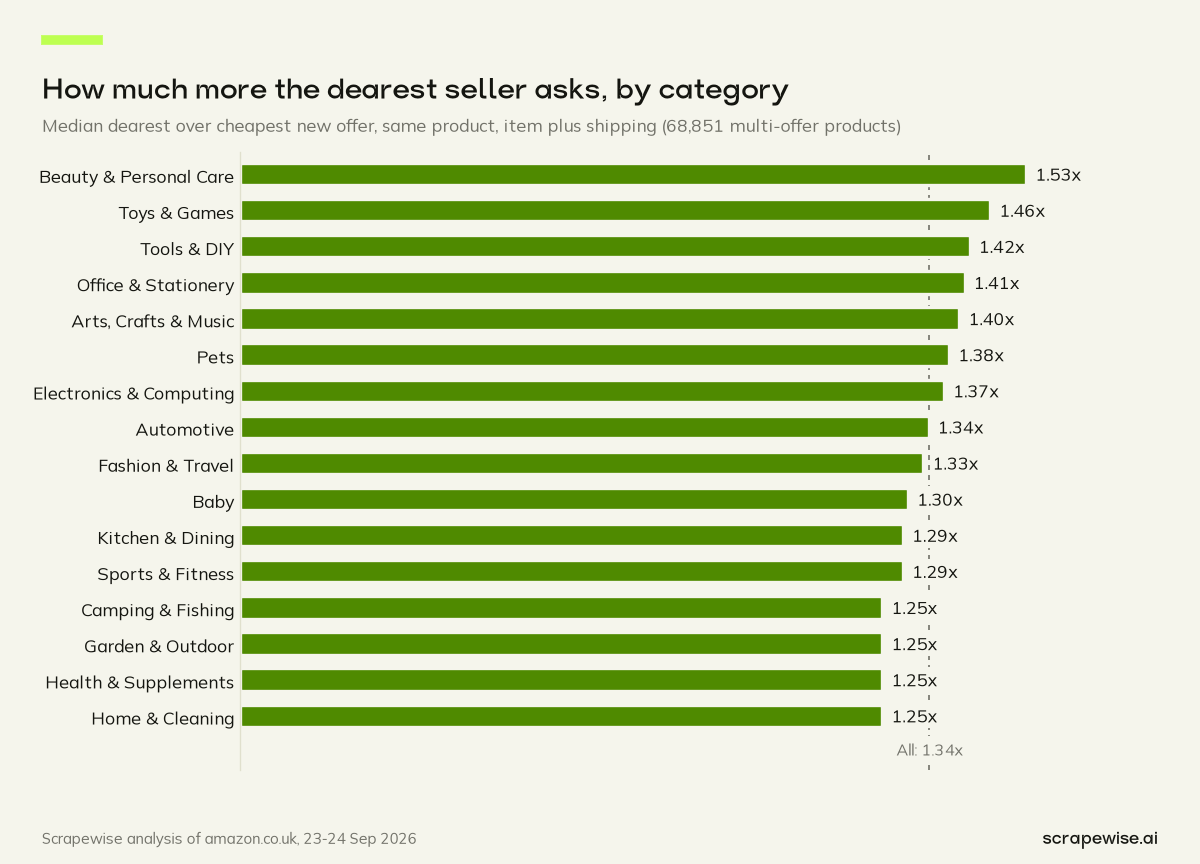
- Beauty & Personal Care has the widest gaps between competing offers: a median 1.53x, and 26.9% of those multi-offer products are 2x or more apart.
- The two cheapest sellers charge exactly the same price on 20.1% of multi-offer products.
The price difference between sellers on the same Amazon product is real but usually moderate: on multi-offer products, the dearest new offer asks a median 1.34x the cheapest, counting item price plus shipping. We checked 68,851 products with two or more new offers in a snapshot of amazon.co.uk taken on 23 to 24 September 2026.
The Data
Same product means the same Amazon listing (the same ASIN), so every seller in the comparison is offering the identical item. For each of those products we took the cheapest and the dearest new offer and divided one by the other. Then we took the median across products, overall and by category.
| Category | Median dearest vs cheapest offer |
|---|---|
| Beauty & Personal Care | 1.53x |
| Toys & Games | 1.46x |
| Tools & DIY | 1.42x |
| Health & Supplements | 1.25x |
| Garden & Outdoor | 1.25x |
| Home & Cleaning | 1.25x |
| Camping & Fishing | 1.25x |
| All multi-offer products | 1.34x |
In money, the median gap between the cheapest and the dearest new offer is £6. The spread has a long tail, though. The widest tenth of products have a dearest-to-cheapest ratio of 2.23 or more, and 15.6% of multi-offer products have a dearest offer 2x or more above the cheapest. At that end, the dearest seller is asking more than double the cheapest price for an identical item, which is a bold position to take.
Where the Gaps Are Widest
Beauty & Personal Care stands out. The median beauty product with competing offers has 5 new offers, the most of any category we measured, and the dearest asks 1.53x the cheapest. In 26.9% of multi-offer beauty products, the gap is 2x or more.
Toys & Games (1.46x) and Tools & DIY (1.42x) come next. At the calm end, Health & Supplements, Garden & Outdoor, Home & Cleaning and Camping & Fishing all sit at 1.25x.
Two things are worth keeping in mind before reading too much into the ranking:
- More offers leave more room for outliers. A product with five sellers has more chances to include one very high ask than a product with two. Part of the beauty gap is simply that beauty listings are more crowded.
- Category comes from the search keyword. We assign a product to a category by the keyword that found it, not by Amazon's own browse tree, so a few products sit in a neighbouring category.
The ratio also says nothing about why a seller prices high. A high ask can come from a seller with little stock and no hurry, or from an old price nobody updated. The offer page does not tell us which.
This is a different question from the one in same product, different price on Amazon. That post compares separate listings that share a title, where most gaps turn out to be pack sizes. Here, every offer sits on one listing, so a gap is a gap between sellers.
Ties and Near-Ties at the Cheapest Price
The other end of the list is more crowded than you might expect. On 13,811 multi-offer products (20.1%), the two cheapest sellers charge exactly the same price, matched to the penny. That is either a remarkable run of coincidences or a repricing rule doing its job. On 30.3%, the second-cheapest offer is within 1% of the cheapest. The median gap between the cheapest and the second-cheapest offer is 7.5%.
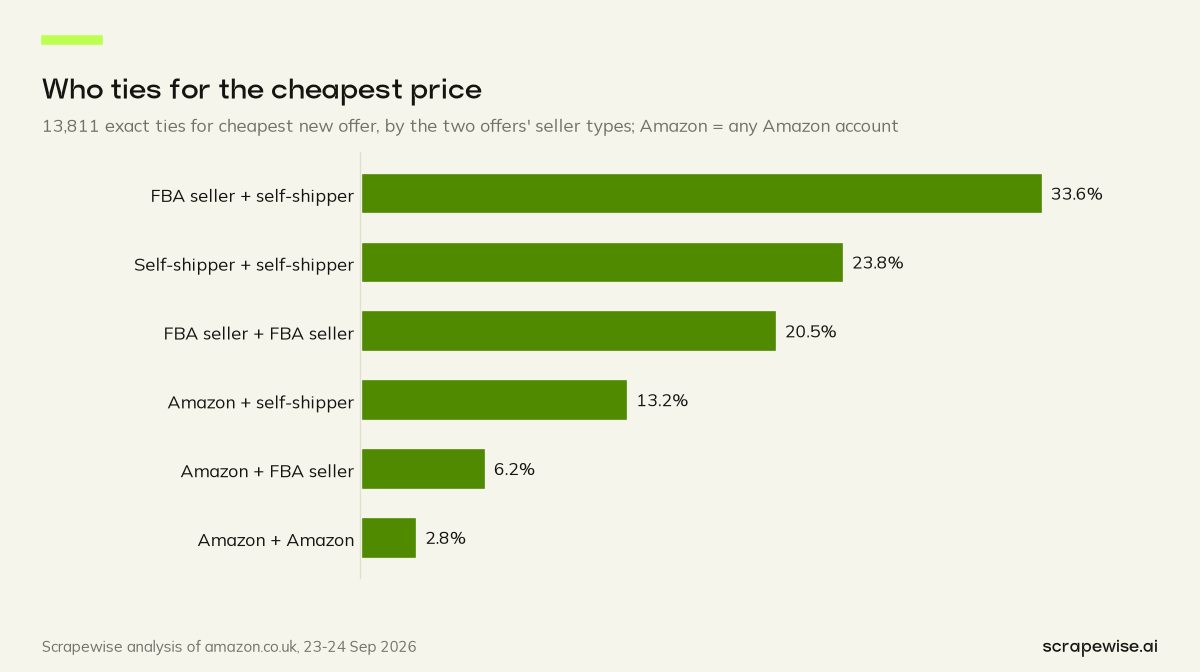
Who ties with whom is telling. The most common pair is an FBA offer and a self-shipped offer, both from third-party sellers, at 33.6% of ties. Two self-shipped offers make 23.8%, and two FBA offers 20.5%. An offer sold by Amazon (any Amazon account) is part of the tie on 3,059 products: paired with a self-shipped offer in 13.2% of ties and with an FBA offer in 6.2%.
FBA here means the offer page said the item ships from Amazon. We did not see fees or margins, only the price a shopper would pay. The tie is also a snapshot. A repricer can move a price minutes after we read it, so the share of ties at any given moment will drift.
What It Means for Sellers, Brands and Pricing Teams
For sellers, the tie data is the useful part. When the two cheapest sellers tie this often, the lowest price is probably set by competing rules as much as by any one seller. Being cheapest by a penny and matching exactly are different strategies, and the offer list shows which one a rival uses. On products with more than one offer, the featured offer (our stand-in for the Buy Box, which Amazon does not label) does not always go to the lowest price either. Our post on whether the lowest price wins the Buy Box measures how often it does, and Amazon buy box competition shows how many sellers a typical listing has.
For brands, a wide gap on your own listing is a prompt to look, not proof of a problem. A dearest offer at 2x the cheapest can be a reseller with one unit left, an old price, or a seller you did not approve. Our guide to Amazon repricing and MAP violation software covers the monitoring side.
For pricing teams, one offer is not the market. If you record only the featured offer, you miss the floor and the ceiling. A better record keeps the cheapest, the median and the dearest new offer per product, plus the number of offers, because a gap from two sellers and a gap from nine are not the same signal. If you match products across shops before comparing them, the matching step matters as much as the price step, as covered in product matching for price monitoring.
How to Measure the Gap on Your Own Listings
The same test works on any set of products you sell or watch:
- Collect the offer list for each product, with the item price, the shipping cost and the condition of every offer.
- Keep new-condition offers only, and add shipping to the item price. A cheap item with dear postage is not a cheap offer.
- For each product, divide the dearest total price by the cheapest, and note the gap between the cheapest and the second-cheapest offer.
- Flag products where the two cheapest offers tie, or sit within a few pence of each other. Those are the listings where a rule, not a person, is most likely setting the price.
- Repeat on a schedule. One snapshot shows where a listing stands today, not where it will stand next week.
Sort the results by gap and by number of offers. A wide gap with many sellers usually means one outlier. A wide gap with two sellers is more likely a real split between them.
For the rest of this dataset, including seller countries, ratings and search positions, see the full Amazon UK market study.
How We Collected This Data
We started from the products found by our 868-keyword search sample on amazon.co.uk, pages 1 to 7. For each product, the Amazon Offers API read the offer page and returned one row per offer, with the item price, shipping cost, condition, where it ships from and whether it was the featured offer. The price gaps and ties above use nothing else. Reading one offer page costs €0.00015 per call, or €0.15 per 1,000 calls. Schedule it daily, every few days, weekly or monthly, or on demand, and collect the rows through the REST API or a CSV/Excel export. Create an account to pull every offer on your own listings.
Every account comes with 5 free requests, enough to measure the gap on a handful of your own listings. After that you pay as you go. Sign up or compare pricing.
Paste a marketplace URL — get structured market data
Size categories, track assortments, monitor trends. Clean feeds ready for your BI stack.
97% accuracy on Amazon benchmarks · no credit card · book a 15-min call →