
Key takeaways
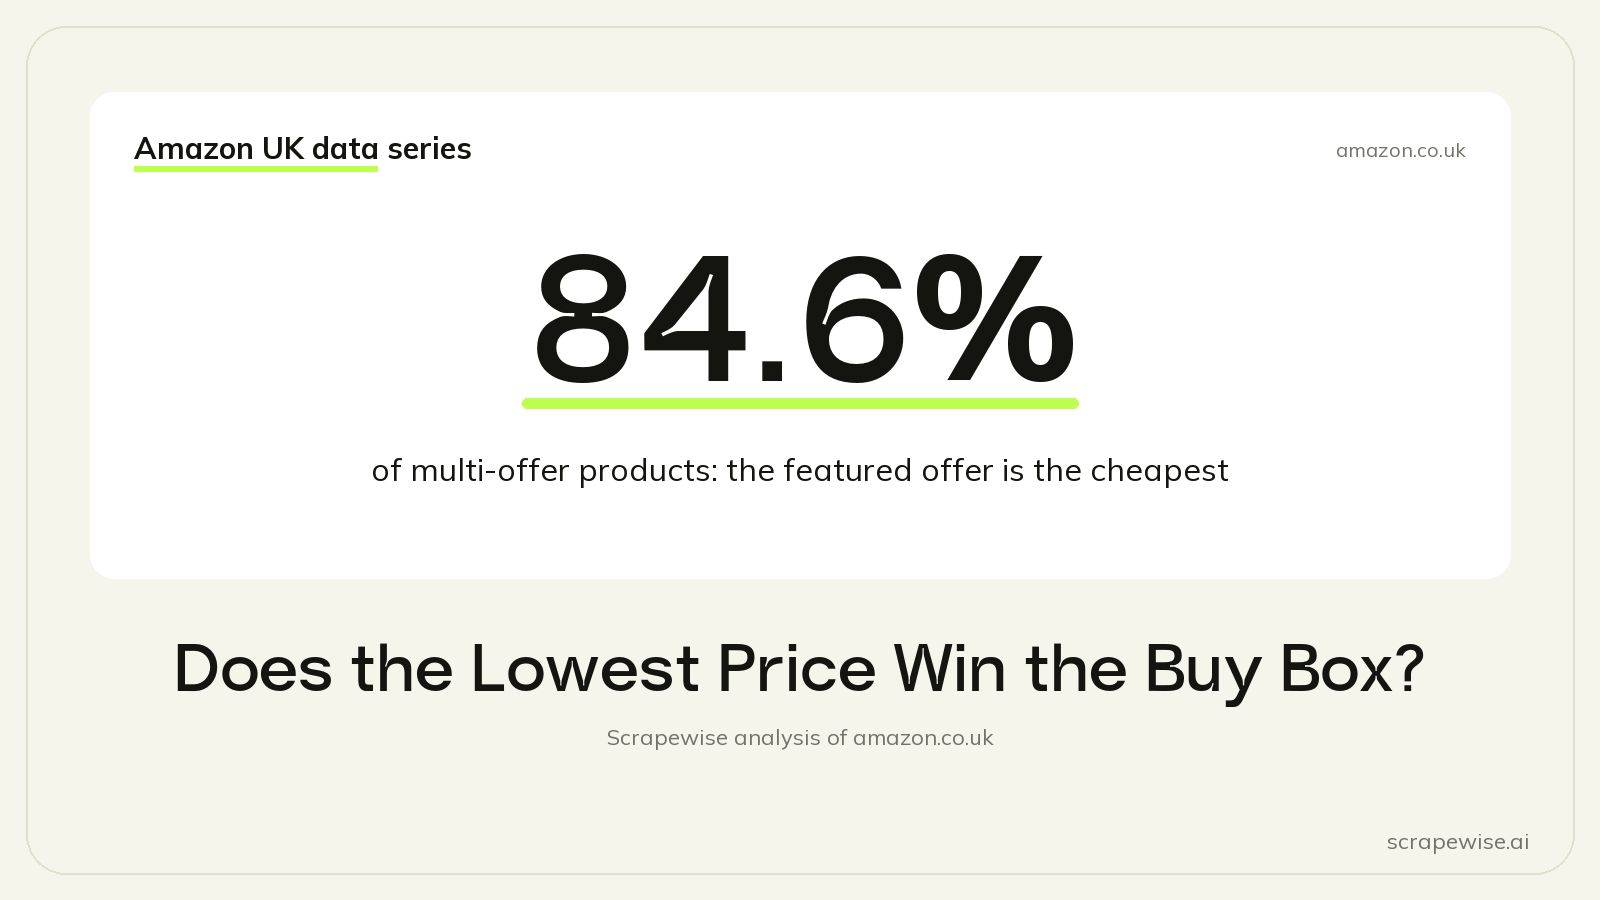
- On 67,696 multi-offer products, the featured offer is the cheapest new offer 84.6% of the time, ties included.
- On multi-offer products, the cheapest offer wins the featured slot 90.4% of the time when sold by Amazon (any Amazon account), 72.9% for FBA sellers and 42.8% for self-shippers.
- When the featured offer on a multi-offer product is not the cheapest, it costs a median 2.7% more and promises faster delivery in 85.8% of cases.
Mostly, yes: on multi-offer products, the featured offer, our stand-in for the Amazon Buy Box, is the cheapest new offer 84.6% of the time, ties included. We checked 67,696 products with two or more new offers and a featured offer in a snapshot of amazon.co.uk taken on 23 to 24 September 2026.
The Data
Price is the biggest single factor, but it does not work the same for everyone. The table splits the new offers on multi-offer products by who sells and ships them, and shows how often each type holds the featured slot when it is the cheapest offer and when it is not.
| Who sells and ships | Featured when cheapest | Featured when not cheapest | Cheapest offers counted |
|---|---|---|---|
| Sold by Amazon (any Amazon account) | 90.4% | 13.0% | 23,798 |
| Third-party, shipped by Amazon (FBA) | 72.9% | 8.7% | 29,157 |
| Third-party, self-shipped | 42.8% | 2.7% | 33,820 |
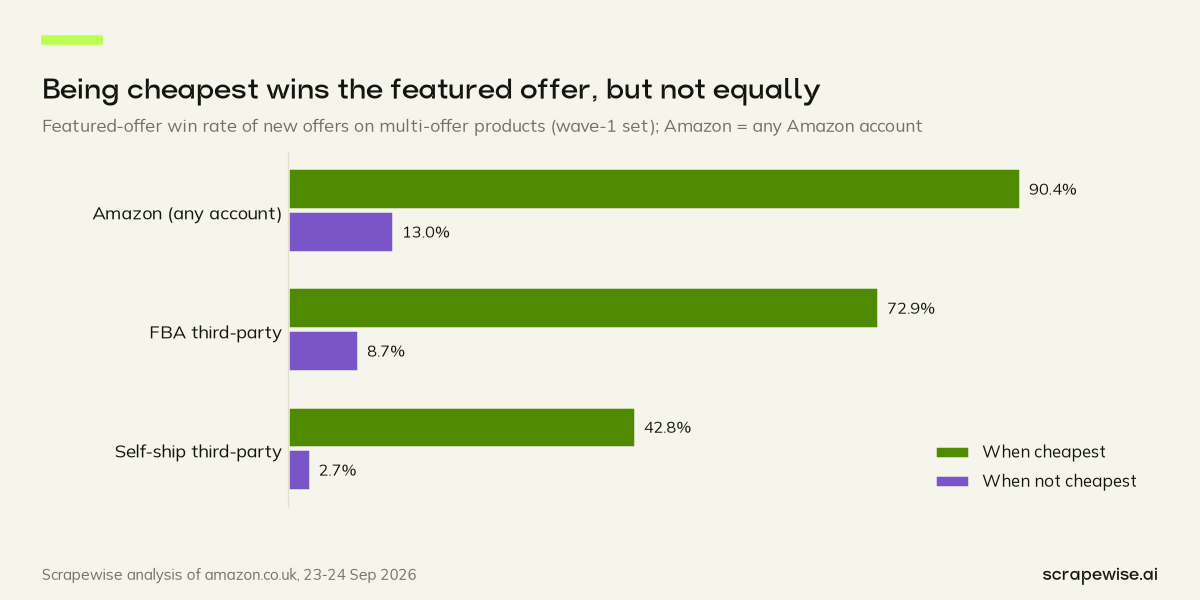
So the lowest price wins most of the time, but who you are changes the odds. A cheapest offer sold by Amazon (any Amazon account) holds the featured slot 90.4% of the time. Cheapest third-party offers shipped by Amazon (FBA) hold it 72.9% of the time. A cheapest self-shipped offer holds it only 42.8% of the time, which means it loses more often than it wins.
Being dearer rarely works for anyone. When an offer is not the cheapest, it is featured 13.0% of the time if Amazon sells it, 8.7% for FBA offers and 2.7% for self-shipped offers.
When the Cheapest Offer Loses
On 10,446 multi-offer products, the featured offer was not the cheapest. Those cases show how much room the featured slot allows.
- The featured offer cost a median 2.7% more than the cheapest one.
- It promised faster delivery in 85.8% of those cases, a median 4 days against 7 for the cheapest offer.
- The cheapest offer that lost was self-shipped 77.9% of the time.
On products with competing offers, then, the featured slot forgives a small premium. It does not seem to forgive a slow delivery date.
The pattern fits the table above: a self-shipped offer that is slightly cheaper but days slower is the most common loser. Delivery dates here are for a logged-out visitor in the UK, counted from the London date of our visit, so they describe standard delivery.
Seller Feedback and the Featured Offer
Feedback matters too. We banded 244,697 third-party offers on multi-offer products by the seller's positive feedback score shown on the offer, then looked at the cheapest offers in each band.
| Seller positive feedback | Featured when cheapest |
|---|---|
| 99 to 100% | 65.9% |
| 95 to 98% | 60.3% |
| 90 to 94% | 55.1% |
| 80 to 89% | 55.1% |
| 70 to 79% | 49.1% |
| under 70% | 43.5% |
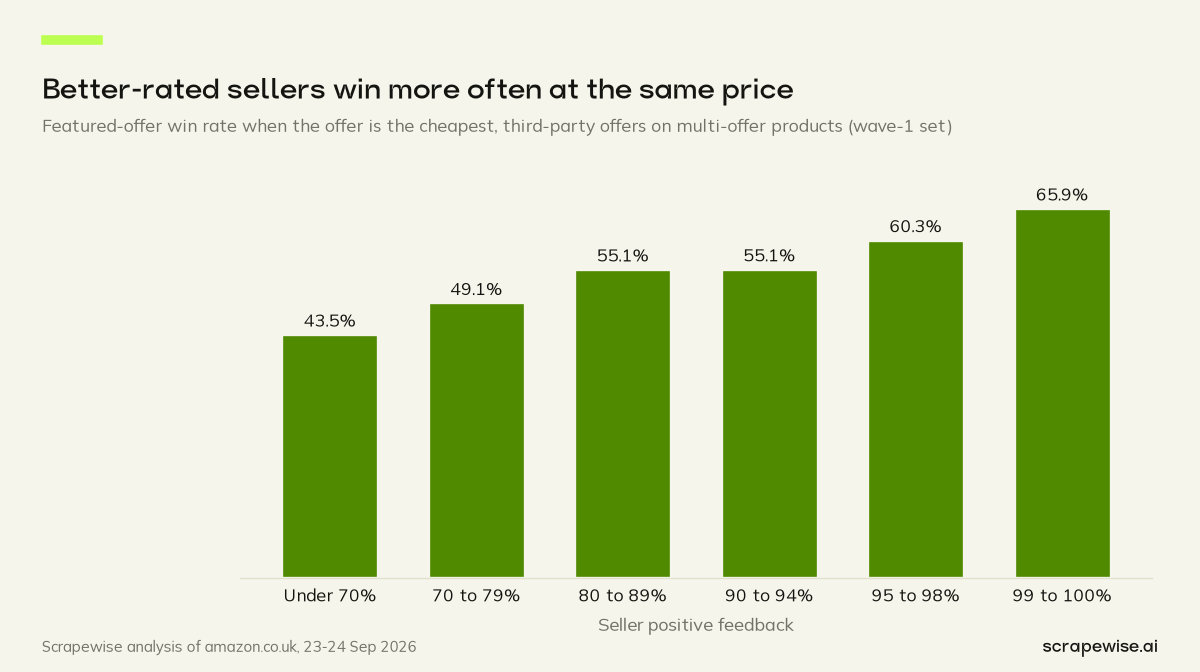
Across every offer, cheapest or not, sellers at 99 to 100% hold the featured slot on 30.1% of their offers, against 8.0% for sellers under 70%. Featured third-party offers carry a median feedback score of 93, against 87 for the other offers.
Treat this with care. Feedback moves with other things: sellers with high scores are often larger, and larger sellers use FBA more. We did not control for that, so the feedback effect and the FBA effect overlap. The direction is clear. The size of each effect on its own is not.
Stock and Postage
Two more signals on the offer page line up with the featured slot, again on multi-offer products:
- Stock depth. The stock figure on the offer page is the number a shopper can add to the basket, and it stops at 30, so "30" means 30 or more. Offers showing 2 or fewer units are featured 12.9% of the time, against 29.7% for offers at 30 or more. Among cheapest offers, it is 50.8% against 68.0%. Low numbers can also be per-order limits, not true stock.
- Postage. Offers that charge for delivery are featured 4.3% of the time, against 23.5% for offers with free delivery.
None of this proves cause. A seller with deep stock and free postage is often also a seller with FBA and good feedback. What the data shows is which offers tend to sit on top, not which lever moved them there.
What It Means for Sellers
If you want the featured slot on a shared listing, being cheapest helps most, but it is often not enough on its own. In practice:
- Price within a few percent of the cheapest offer, not far above it. The median winner that was not cheapest was only 2.7% dearer.
- Close the delivery gap. When a dearer offer wins, it is usually the faster one, and a self-shipped offer that is days slower often loses even at the lowest price.
- Keep stock and feedback healthy. Neither guarantees the slot, but both line up with holding it.
For pricing teams, the lesson is to record more than the price. A price file that holds only the featured offer cannot tell you whether you lost the slot on price, on delivery or on something else. Keep the full offer list per product, with ships-from, delivery promise, stock and feedback, and compare your offer with the one that won. The losing reason is often visible in the row next to yours.
For shoppers, the flip side is worth knowing. The top offer on a product with several sellers is usually the cheapest, but not always. When it is not, the difference is small and tends to buy faster delivery, so a quick look at the full offer list is enough to decide whether the extra is worth paying.
For how many sellers share a listing in the first place, see Amazon buy box competition. For the tools that automate price moves and watch minimum advertised prices, see our guide to Amazon repricing and MAP violation software. For a wider method on watching rivals, see how to track competitor pricing strategies. Every other angle on this snapshot is in the full Amazon UK market study.
How We Collected This Data
The Amazon Offers API opened the offer page of every product in our amazon.co.uk sample and gave us one row per offer: item price, shipping cost, condition, where it ships from, the seller's positive feedback score, the stock a shopper can add to the basket, and whether the offer was featured. Those fields are all the win rates above use. Checking a listing costs €0.00015 per call, or €0.15 per 1,000 calls. Run it on a schedule and it keeps a price history, so you see what changed after each run, and every run's rows show who held the featured slot. Create an account to check who holds the featured offer on your listings.
Is your cheapest offer actually holding the featured slot? Check a few of your listings with 5 free requests; after that, each call is paid as you go. Sign up or compare pricing.
Paste a marketplace URL — get structured market data
Size categories, track assortments, monitor trends. Clean feeds ready for your BI stack.
97% accuracy on Amazon benchmarks · no credit card · book a 15-min call →