
Key takeaways
- Amazon is among the sellers on 17.2% of the 197,022 products in our Amazon UK sample.
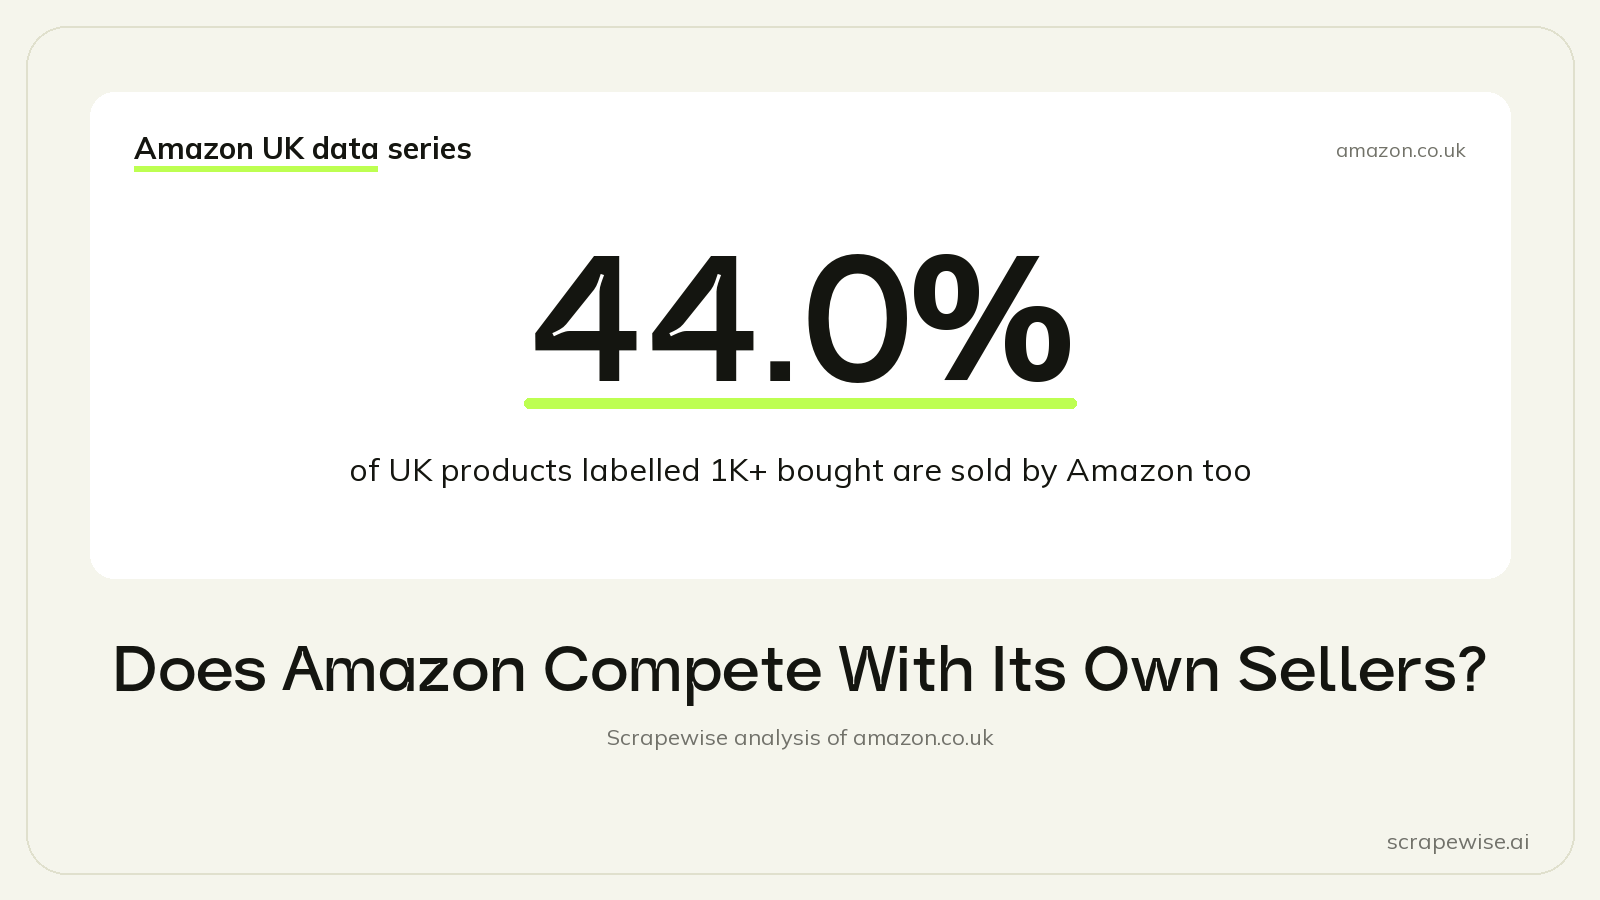
- On products labelled 1K+ bought in past month, Amazon is among the sellers on 44.0% of them.
- In the same keyword, Amazon's own listings have a median 2.35x to 2.76x the reviews of marketplace sellers' listings.
Yes, and most often where sales are highest: Amazon is among the sellers on 17.2% of the 197,022 products in our Amazon UK sample, and on 44.0% of products labelled 1K+ bought in past month. The seller lists come from the offer page of each product, read on amazon.co.uk on 23 to 24 September 2026.
How Often Amazon Sells Next to Its Sellers
Amazon runs the marketplace and also sells on it. On most products it stays out, but its presence rises sharply where sales are high.
| Group | Share where Amazon sells |
|---|---|
| All products | 17.2% |
| Amazon is the sole seller | 5.4% |
| Labelled 1K+ bought | 44.0% |
| Beauty and personal care | 25.8% |
| Camping and fishing | 7.7% |
| Search page 1 | 23.8% |
| Search page 7 | 12.8% |
Across the whole sample, Amazon sells on 33,966 products, about one in six. On 10,689 of them, 5.4% of all products, Amazon was the only seller, so there was no marketplace seller to compete with.
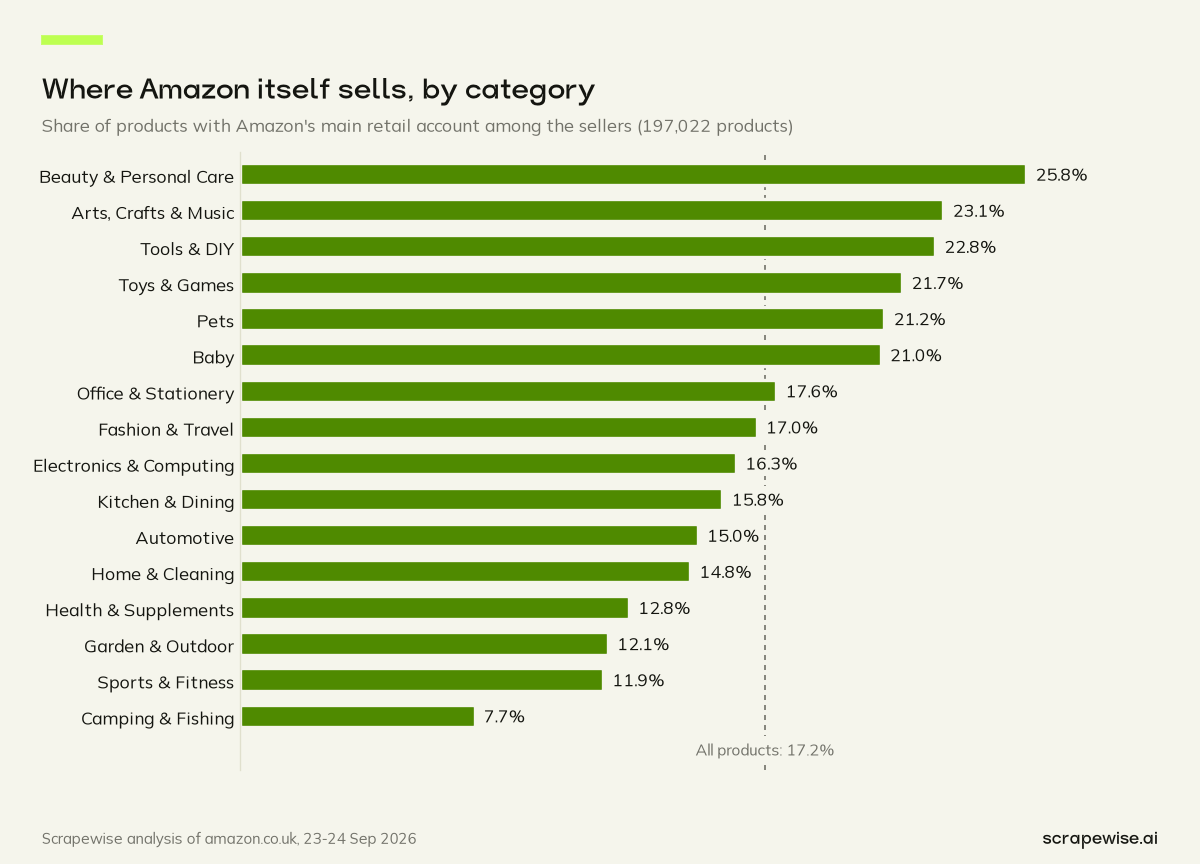
Category matters. Beauty and personal care has the highest Amazon presence in our data at 25.8%, and camping and fishing the lowest at 7.7%. A seller in camping gear meets Amazon's own offer far less often than a seller of shampoo or skincare, so the answer to our title depends a lot on what you sell.
Where Amazon Concentrates: High-Volume Products
The clearest pattern is volume. Of the 7,181 products labelled 1K+ bought in past month, Amazon is among the sellers on 44.0%. That is well above its 17.2% share across all products.
Search position tells a similar story. Amazon sells on 23.8% of page-1 products and on 12.8% of products on page 7. The products that rank best and sell most are where Amazon most often lists its own offer.
The same shows up in the badge data. Of the 625 products with an Amazon's Choice badge, Amazon is among the sellers on 44.5%.
One exception: sponsored results. Amazon is among the sellers on 17.5% of organic results but on 8.6% of sponsored ones. So most of the ads we saw were for products that Amazon does not sell itself.
Competition on Crowded Listings
When Amazon shares a listing, it shares it with a crowd. On products where Amazon and other sellers both appear, there is a mean of 3.76 other sellers.
Amazon's products are also more crowded overall. 10.1% of products that Amazon sells on have 10 or more sellers, against 2.3% of products without Amazon. Our capture stops at about 11 sellers per product, so the most crowded listings are undercounted. We look at the most contested products in the most competitive Amazon products, and at how many sellers a typical listing has in Amazon buy box competition.
Same Search, Different Numbers
To compare like with like, we looked inside each keyword. For every keyword with enough products on both sides, we compared Amazon's own listings with marketplace sellers' listings in the same search.
| Same-search pair | Reviews (median ratio) | Price (median ratio) |
|---|---|---|
| Amazon vs China and Hong Kong-based sellers | 2.76x | 1.06x |
| Amazon vs UK-based sellers | 2.35x | 0.96x |
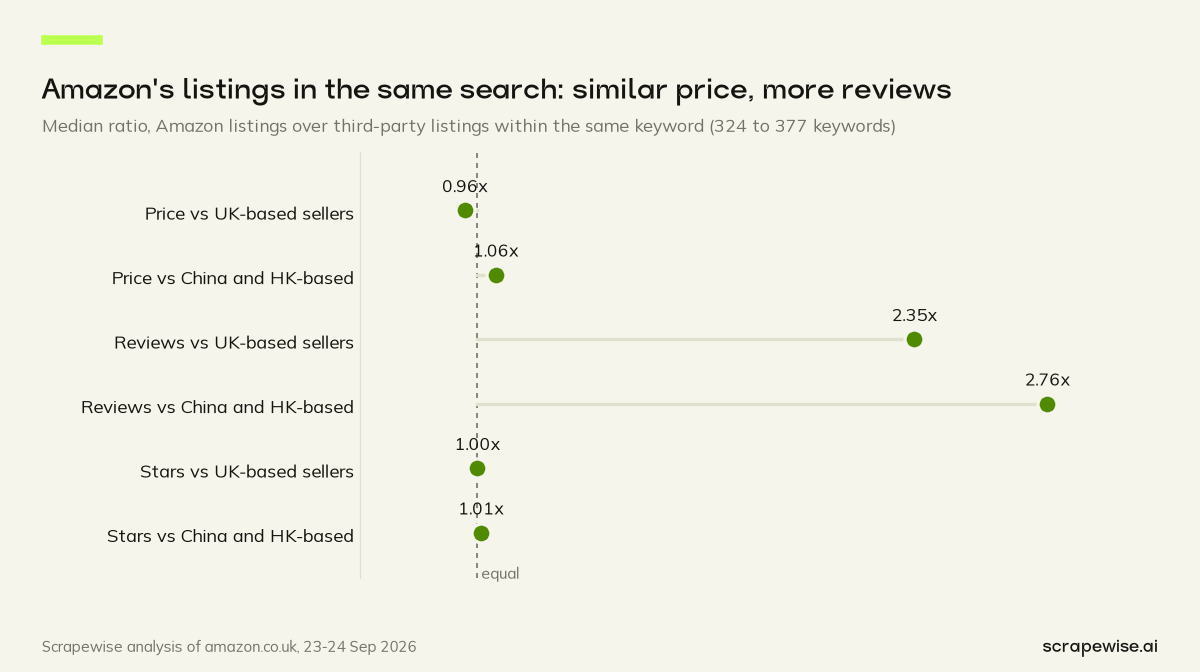
The review gap is large. Across 324 keywords, Amazon's listings have a median 2.76x the reviews of listings from China and Hong Kong-based sellers. Across 347 keywords, they have 2.35x the reviews of UK-based sellers' listings.
Price is close. Amazon's listings are priced at a median 1.06x those of China and Hong Kong-based sellers in the same search, and 0.96x those of UK-based sellers. The gap between Amazon and marketplace sellers is in reviews, not in price.
This fits the other numbers. On single-seller listings, Amazon holds 7.5% of listings but 18.1% of the minimum unit volume, as we show in Amazon UK sellers by country. Price on the very same product is a separate question: where an offer sold by Amazon (any Amazon account) and a third-party offer are both new, Amazon's is cheaper on 52.1% of those products, as our look at whether Amazon is cheaper than third-party sellers shows.
What the Snapshot Leaves Out
A one-day view has limits, and three of them matter here.
First, an offer listing shows the offers that are live at that moment. If Amazon's own stock had run out on the day, its offer may not have appeared, so the true share of products where Amazon sells from time to time is probably higher than the snapshot shows.
Second, we capture about 11 sellers per product at most. On very crowded listings, some sellers are missing from our count, which is why the 10-or-more figures above are floors.
Third, "Amazon among the sellers" says nothing about who wins the sale. When several sellers offer the same product, one of them is shown as the featured offer. Whether that is Amazon depends on price, delivery and other factors we do not measure in this post.
How to Check Your Own Products
If you want to know whether Amazon sells on the products you care about, the check is simple to repeat:
- List the products: your own best sellers, plus the products you are thinking of entering.
- Read each offer listing. Record every seller, its price and condition, and whether Amazon's own offer is there.
- Add search data. The search position and sales label show whether a product sits in the high-volume zone where Amazon is most active.
- Repeat the check. The most useful signal is the day Amazon's offer first appears on a product it did not sell before.
What It Means for Sellers and Brands
Amazon does compete with its marketplace sellers, but not everywhere. Its offers cluster on high-volume, well-reviewed products.
- Check your own products for an Amazon offer. If Amazon sells on your best sellers, your rival has, in the same search, a median 2.35x to 2.76x the reviews.
- Expect Amazon where volume is high. Its own offer sits on 44.0% of products that show 1K+ bought in past month, so moving into a proven seller often means meeting Amazon.
- Do not plan to beat it on price alone. Amazon's prices sit close to marketplace prices in the same search.
- Watch for Amazon arriving. A snapshot shows where Amazon is today. Reading the same offer listings again later shows when it starts selling on a product you care about.
For the repricing and brand-protection side of this, see Amazon repricing and MAP violation software. For broader uses of competitor data, see beyond price tracking.
How We Collected This Data
We used two Scrapewise data APIs on amazon.co.uk. The Amazon Search API ran 868 keywords, pages 1 to 7, and returned each product's price, review count, category keyword, page position, sponsored flag and "bought in past month" label. The Amazon Offers API then read the offer listing of each product and returned every offer with its seller, price and condition, which told us whether Amazon's own offer was there and how many sellers competed. Both cost €0.00015 per call, €0.15 per 1,000 calls, and either can run on demand or on a schedule. Open an account and point the Offers API at your own product list to see where Amazon's offer turns up.
All the other findings from the study are in the Amazon UK Marketplace Report 2026.
Is Amazon on the offer listings of your best sellers? Your 5 free requests will answer that for a handful of them. Create your account, then check pricing for the rest of the catalogue.
Paste a marketplace URL — get structured market data
Size categories, track assortments, monitor trends. Clean feeds ready for your BI stack.
97% accuracy on Amazon benchmarks · no credit card · book a 15-min call →