
Key takeaways
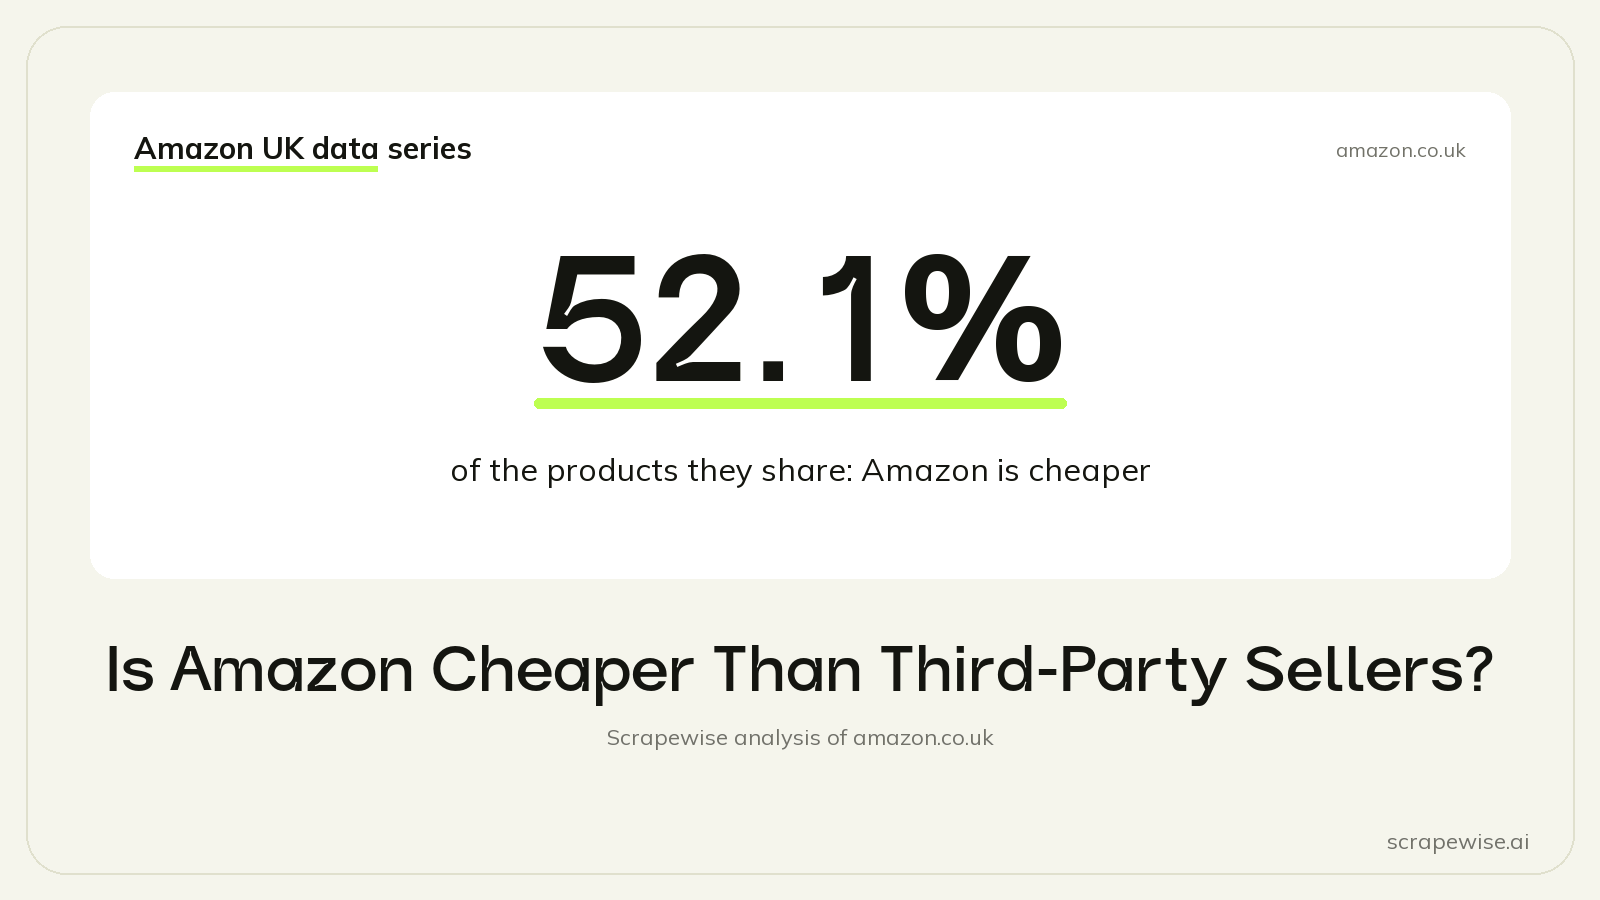
- Where both sell the same product new, the offer sold by Amazon (any Amazon account) is cheaper on 52.1% of 32,356 products and dearer on 38.6%.
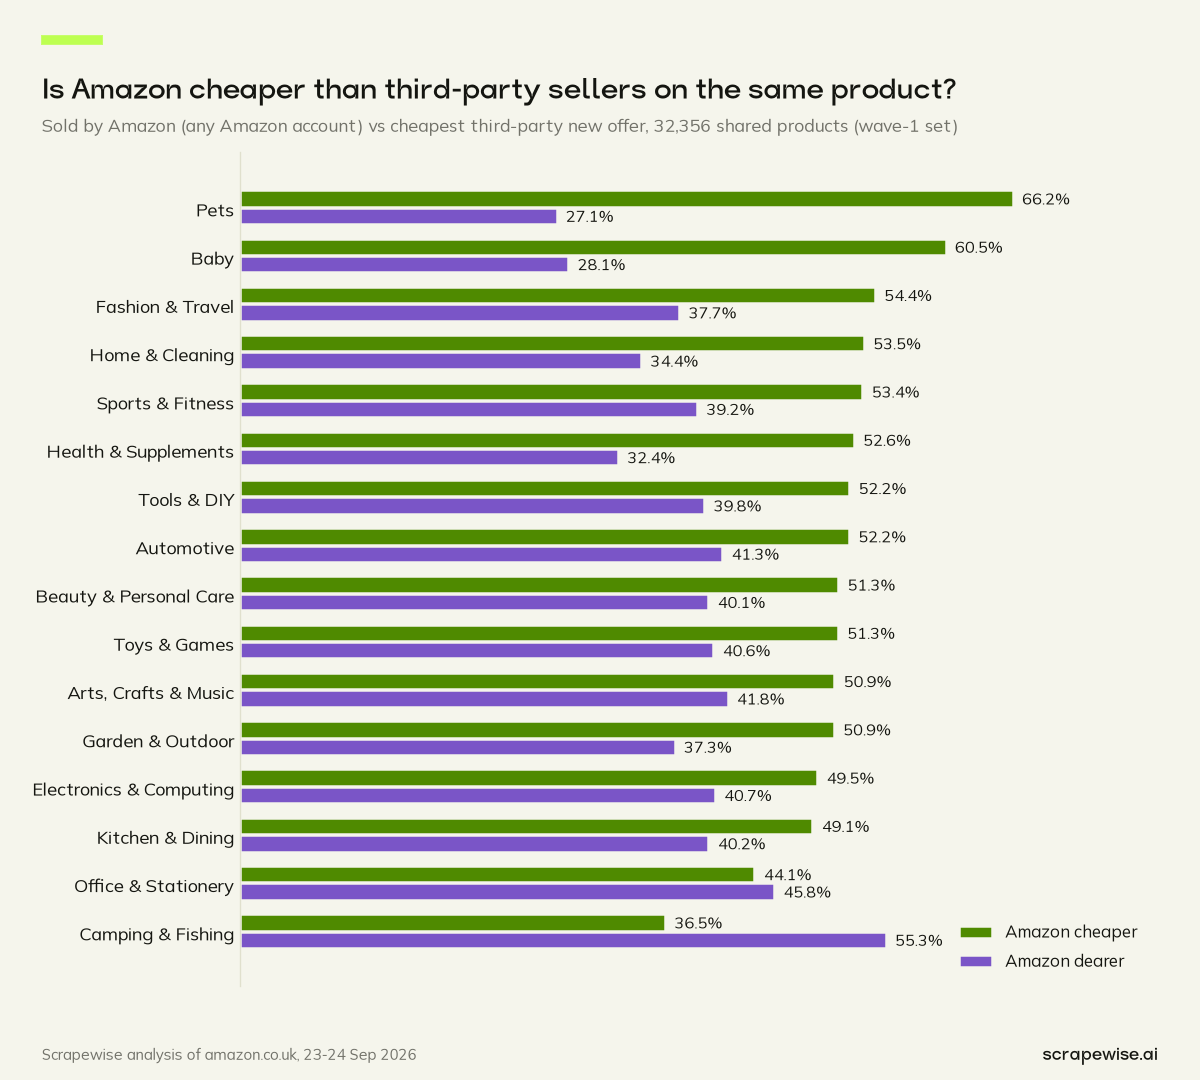
- In Pets, Amazon is cheaper on 66.2% of shared products; in Camping & Fishing, it is dearer on 55.3%.
- When Amazon is dearer, its median premium is 13.2%, and the dearer Amazon offers that still hold the featured slot are a median 2.5% above the cheapest third party.
Amazon is cheaper than third-party sellers on 52.1% of the products they share: where an offer sold by Amazon (any Amazon account) and one or more third-party offers are both new, Amazon's is dearer on 38.6% and the same price on the rest. We checked 32,356 such products in a snapshot of amazon.co.uk taken on 23 to 24 September 2026.
The Data
The table covers every product in our sample that was sold new both by Amazon and by one or more third-party sellers.
| Measure | Value |
|---|---|
| Products compared | 32,356 |
| Amazon cheaper | 52.1% |
| Amazon dearer | 38.6% |
| Same price, within a penny | 10.3% |
| Median ratio to cheapest third party | 0.985 |
| Amazon holds the featured offer | 65.3% |
So the honest answer is "more often than not, but only just". The median ratio of 0.985 means the typical Amazon offer sits just below the cheapest third-party offer on the same product. That is a narrow edge, and on 38.6% of shared products it runs the other way.
The featured offer, our stand-in for the Buy Box, goes to Amazon on 65.3% of these products. Every product here has competing offers by definition, since Amazon and one or more third-party sellers offer it, so this is a genuine contest and not a default.
Where Amazon Is Cheapest, and Where It Is Not
The category split is where the answer changes. In Pets, the offer sold by Amazon is cheaper on 66.2% of shared products, with a median ratio of 0.875 against the cheapest third-party offer. That is the clearest Amazon price lead in our data.
Camping & Fishing goes the other way. There, Amazon is dearer on 55.3% of the shared products we could compare. Most other categories sit close to the overall split.
Category here comes from the search keyword that found the product, so the groups are broad. Read the category results as a guide to where to look, not as a fixed rule for every product in that category.
When Amazon Is Dearer
On the products where Amazon is dearer, the gap is not small: a median 13.2% above the cheapest third-party offer. Amazon holds the featured offer on 23.7% of those products.
The ones it keeps have a much smaller gap. Where Amazon is dearer and still featured, its median premium is 2.5%. Amazon can be dearer and keep the top spot, but by a whisker.
When Amazon's offer is cheaper or equal, it holds the featured slot on 91.4% of shared products. Price is not the only factor, but on these listings it lines up closely with who ends up on top.
When Amazon's Own Delivery Slips
Price is one part of the picture. Delivery is another. We looked at 60,214 new offers sold by Amazon (any Amazon account) that showed a delivery date for a logged-out visitor in the UK.
- 36.3% of them promised delivery more than 7 days out, and 3.9% more than 30 days out.
- Slow Amazon offers showed a median stock of 19, against 30 for fast ones. The stock figure stops at 30, so 30 means 30 or more.
- Sports & Fitness had the highest share of slow Amazon offers at 51.0%, then Electronics & Computing at 44.8%. Beauty & Personal Care (20.3%) and Health & Supplements (12.6%) had the lowest.
A delivery date more than a week away on an Amazon offer often reads like a back-order: the item is listed, but not in the warehouse right now. That is our interpretation, not something the offer page states. On sports kit, Amazon itself seems to be in no great hurry.
For third-party sellers, those slow Amazon offers are the obvious opening. A seller with stock on hand can offer a faster date on the same listing while Amazon waits for its own delivery.
What It Means for Sellers, Brands and Pricing Teams
For sellers sharing a listing with Amazon, the data says the contest is closer than it looks. Amazon is cheaper on 52.1% of shared products, not on nearly all of them, and in Camping & Fishing it is more often dearer. Competing with Amazon on price is hardest in Pets, where its lead is widest.
For brands, Amazon as a reseller of your products does not always set the lowest price on your listing. When it is dearer, some third-party seller sits below it by definition, which matters if you track minimum advertised prices. The monitoring side is covered in our guide to Amazon repricing and MAP violation software.
For pricing teams, do not treat Amazon's price as the market floor. On 38.6% of shared products it is not. Record the cheapest third-party offer next to Amazon's, along with who holds the featured slot, so you see both sides of the listing.
How to Run the Same Check on Your Listings
You can repeat this comparison for any list of products:
- Pull the offer list for each product, with the seller, item price, shipping cost, condition and featured flag of every offer.
- Mark the offers sold by Amazon's own accounts, and keep new-condition offers only.
- For each product with both kinds of seller, take the cheapest Amazon offer and the cheapest third-party offer, item plus shipping, and divide one by the other.
- Note who holds the featured offer, and the delivery date on Amazon's offer. A cheap Amazon offer with a date weeks away is a different competitor from one arriving tomorrow.
- Run it again next week. Amazon's position on a listing can change with a single delivery into its warehouse.
Group the results by category and you will see quickly where Amazon leads on price in your part of the catalogue, and where it leaves room.
For how often Amazon sells at all across the marketplace, see does Amazon compete with its own sellers, which uses a narrower definition of Amazon. For how crowded listings are, see Amazon buy box competition. The full Amazon UK market study has every other angle on this snapshot.
How We Collected This Data
Every number here comes from the Amazon Offers API. It read the offer page of each product in our amazon.co.uk sample and returned one row per offer, with the seller ID, item price, shipping cost, condition, the promised delivery date, the stock a shopper can add to the basket and whether the offer was featured. The seller ID is how we told Amazon's own accounts apart from third-party sellers. It costs €0.00015 per call, or €0.15 per 1,000 calls, and every offer row, Amazon's included, is yours through the REST API or a CSV/Excel export. Create an account to compare Amazon's price with the other sellers on your own products.
Is Amazon undercutting you, or are you undercutting Amazon? Find out on a few listings with 5 free requests, then pay per call. Sign up or compare pricing.
Paste a marketplace URL — get structured market data
Size categories, track assortments, monitor trends. Clean feeds ready for your BI stack.
97% accuracy on Amazon benchmarks · no credit card · book a 15-min call →