
Key takeaways
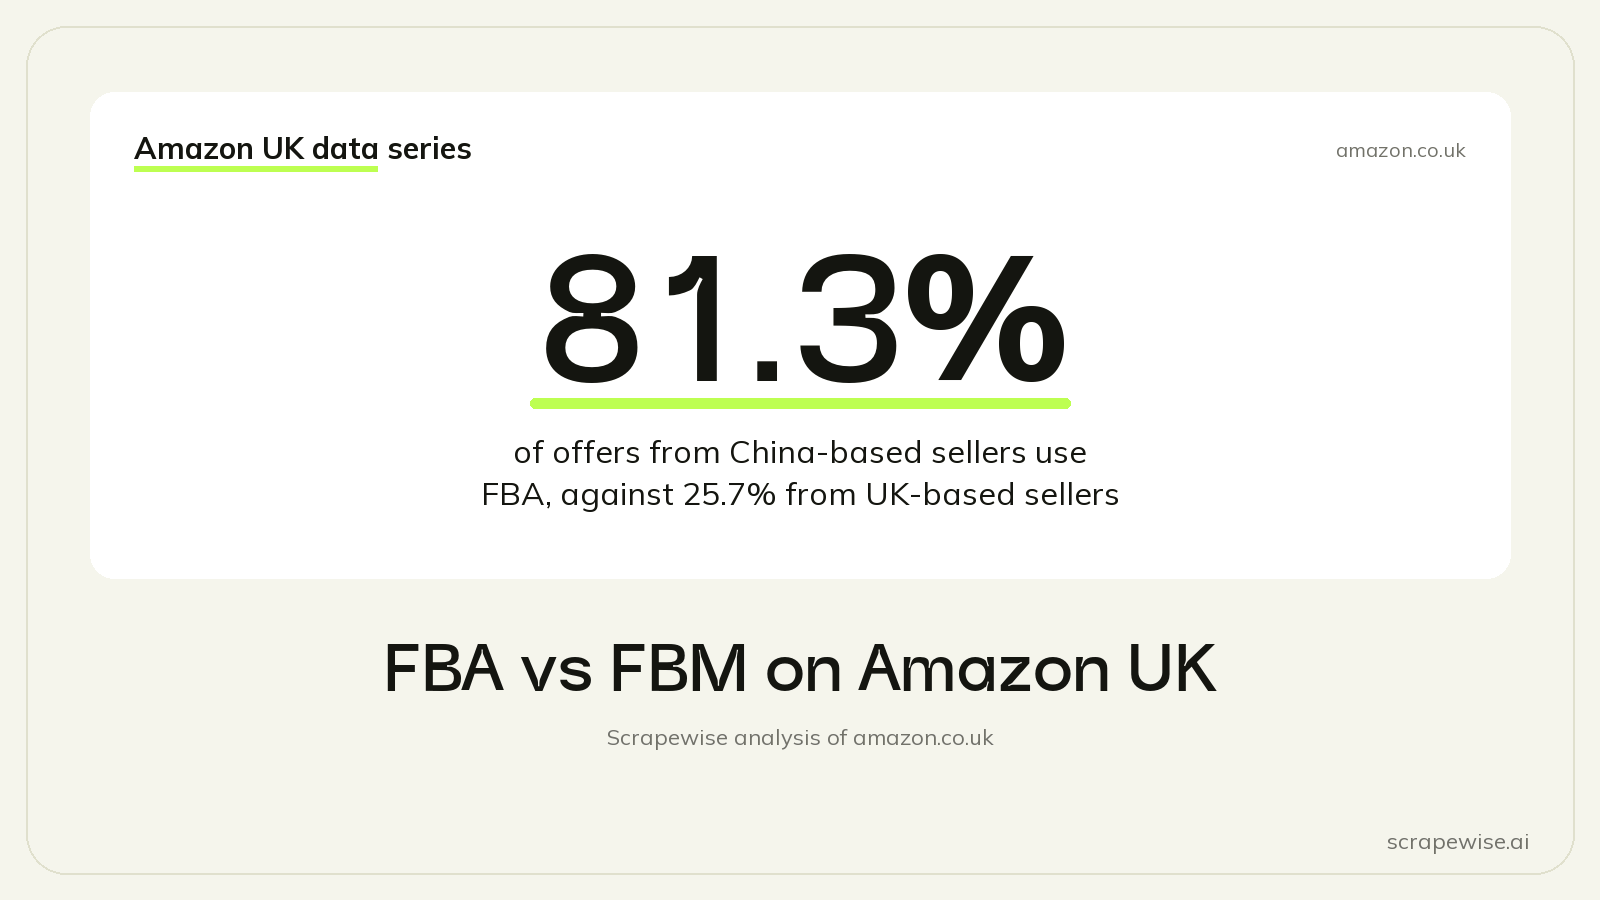
- 81.3% of new offers from China-based sellers are shipped by Amazon (FBA), against 25.7% for UK-based sellers.
- On 25,986 products with both, the cheapest FBA offer is cheaper than the cheapest self-shipped one in 46.8% of cases, and the median price ratio is 1.00.
- Offers shipped by Amazon promise a median 4 days on those products, against 6 days for self-shipped offers.
The FBA vs FBM split on Amazon UK depends on where a seller is based: 81.3% of new third-party offers from China-based sellers are shipped by Amazon (FBA), against 25.7% of offers from UK-based sellers. We checked the offer pages of 196,711 products in a snapshot of amazon.co.uk taken on 23 to 24 September 2026.
The Data
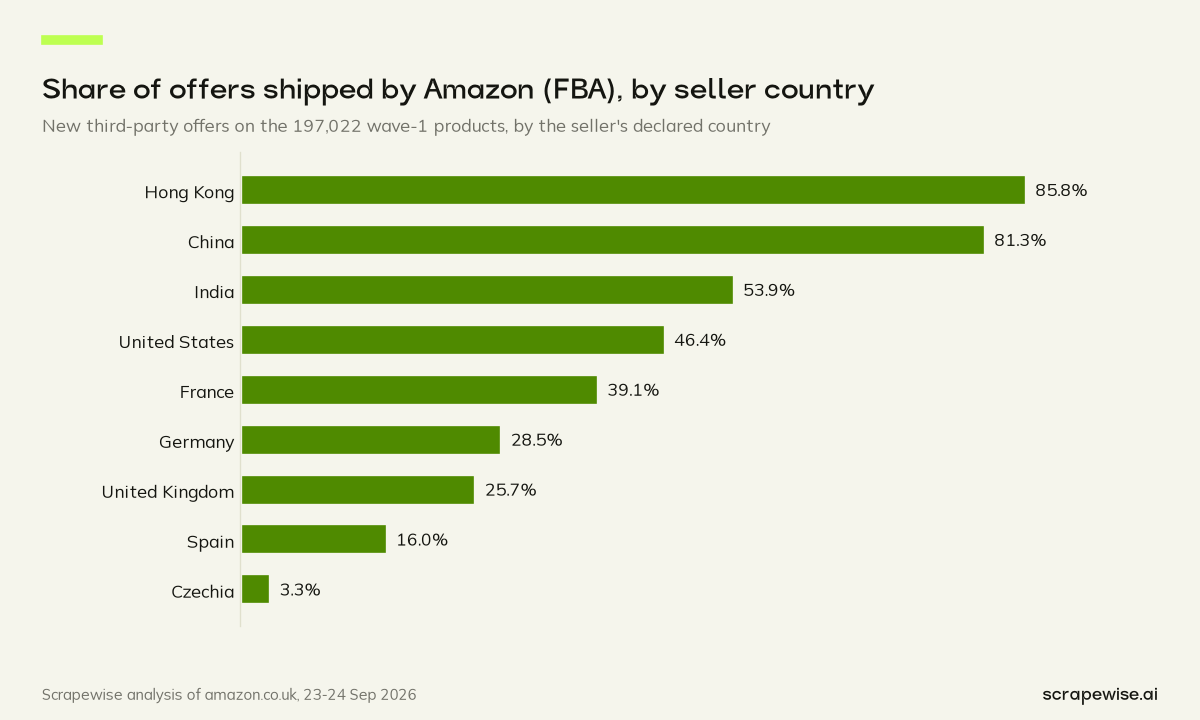
The table counts new-condition offers from third-party sellers, grouped by the country on the seller's profile. The first column is the share of those offers that ship from Amazon. The second is the share of sellers from that country who use FBA on every offer we saw from them.
| Declared seller country | Share of new offers shipped by Amazon (FBA) | Share of sellers using FBA on every offer |
|---|---|---|
| Hong Kong | 85.8% | 86.7% |
| China | 81.3% | 77.8% |
| India | 53.9% | not measured |
| United States | 46.4% | 83.8% |
| France | 39.1% | not measured |
| Germany | 28.5% | 57.7% |
| United Kingdom | 25.7% | 49.3% |
| Spain | 16.0% | not measured |
| Czech Republic | 3.3% | not measured |
FBM means fulfilled by merchant: the seller ships the order itself. By that measure, UK-based sellers are the self-shipping group. Most of their new offers go out from the seller's own premises rather than an Amazon warehouse.
Offers and Sellers Tell Different Stories
The two columns do not always agree, and the gap is informative. Take the United States. Only 46.4% of offers from US-based sellers ship from Amazon, yet 83.8% of US-based sellers use FBA on every offer. The likely reading is that most US-based sellers are FBA users with a few listings each, while a small number of self-shipping sellers list a great many products and pull the offer share down.
The United Kingdom shows the same pattern at a larger scale. Just 25.7% of offers from UK-based sellers are FBA, but 49.3% of UK-based sellers use FBA for everything. So a typical UK-based seller is roughly as likely to be all-FBA as not, while the bulk of UK offers comes from sellers who ship their own orders.
China and Hong Kong are the most consistent. A large majority of offers and of sellers use FBA. For a seller whose business address is far from UK customers, shipping stock into an Amazon warehouse is one way to promise UK delivery times without posting each order across borders.
At the other end, offers from Spain-based (16.0%) and Czech Republic-based (3.3%) sellers are mostly self-shipped. Those groups are small next to the UK and China, so read them as a direction, not a precise rate.
Who Holds the Featured Offer
Every listing pins one offer at the top of its offer list, the featured offer. Across all 194,313 featured offers we saw, China-based sellers held 37.5%, UK-based sellers 29.8%, offers sold by Amazon (any Amazon account) 19.5%, Hong Kong-based sellers 4.9% and US-based sellers 1.6%. For 2.7%, the seller profile gave no country.
These shares count single-offer listings too, where the only offer sits on top by default. So they describe who holds the top spot across listings. They are not a Buy Box win rate. They also reflect volume: China-based and UK-based sellers list the most offers, so they hold the most top spots. A seller group with few offers can still win often on the listings where it competes.
A win rate needs products with competing offers, where the featured offer works as our stand-in for the Buy Box (Amazon does not label it). On multi-offer products, the cheapest offer won the featured slot 72.9% of the time for third-party FBA offers, and 42.8% of the time for self-shipped ones. So when an offer was the cheapest, being shipped by Amazon went with a much higher chance of the top spot. Our post on whether the lowest price wins the Buy Box looks at this in detail.
Does FBA Cost the Shopper More?
A common worry is that FBA pushes the shopper price up, because the seller has fees to cover. On the shelf, we found no sign of it. We looked at 25,986 products that had both an FBA offer and a self-shipped offer from third-party sellers, and compared the cheapest of each, item plus shipping.
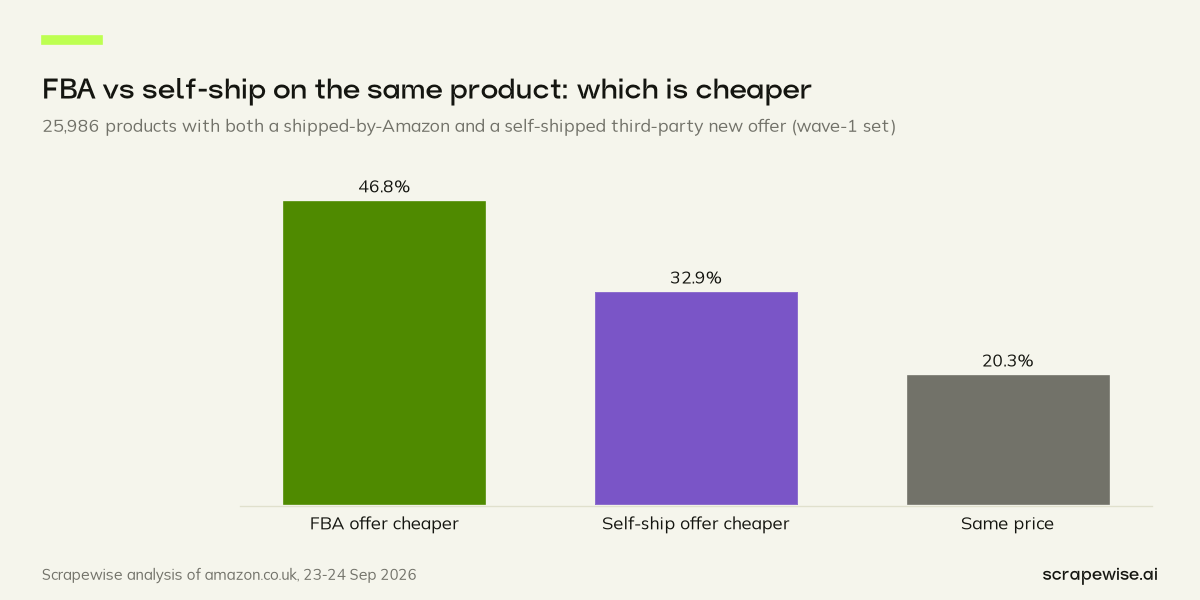
The cheapest FBA offer was cheaper in 46.8% of cases, dearer in 32.9% and exactly equal in 20.3%. The median ratio of the two prices is 1.00. On the same products, FBA offers promised a median 4 days, against 6 for self-shipped ones. On these products, the shopper does not pay extra for FBA at the median. Any cost of FBA, such as its fees, stays out of sight on the offer page.
That last point matters. Fees, storage costs and margins are invisible to us, and so is where the stock physically sits: a declared address says where the business is registered, not which warehouse holds the goods. A seller can match a self-shipper's price and still earn less on each sale. The data shows what the shopper pays, not what the seller keeps.
What It Means for Sellers and Brands
- If you self-ship, you compete against FBA offers that are no dearer for the shopper and promise delivery two days sooner at the median. Price alone has to work harder for you.
- If you use FBA, your advantage is speed and the featured slot, not a higher price. We saw no FBA premium on the shelf.
- If you set prices, record the fulfilment type next to every competitor price. A self-shipped offer and an FBA offer at the same price are not the same offer to a shopper, and a price comparison that ignores the difference will misread why one of them sells.
- If you watch resellers on your brand's listings, the ships-from field tells you who holds stock in an Amazon warehouse and who ships from their own premises. That is useful context when an unknown seller appears.
For the seller-country picture across the whole marketplace, see Amazon UK sellers by country. For how crowded listings are in the first place, see Amazon buy box competition. If fulfilment changes your pricing rules, our guide to Amazon repricing and MAP violation software covers the tooling side, and price intelligence in the tariff era covers cross-border margins. The rest of the snapshot, from ratings to search pages, is in the full Amazon UK market study.
How We Collected This Data
For each product found by our 868-keyword search sample on amazon.co.uk, the Amazon Offers API read the offer page and returned one row per offer, with the seller ID, item price, shipping cost, condition, where the offer ships from and whether it was the featured offer. The Amazon Seller API returned the declared business address from each seller's public profile, which gave us the country; we publish only aggregates. Both APIs are priced at €0.00015 per call, or €0.15 per 1,000 calls, and you can pull the results through the REST API or a CSV/Excel export. Create an account to see how the sellers on your own listings fulfil their orders.
Want to know which of your competitors ship from an Amazon warehouse? Your first 5 free requests will tell you for a few listings, and after that it is pay as you go. Sign up or compare pricing.
Paste a marketplace URL — get structured market data
Size categories, track assortments, monitor trends. Clean feeds ready for your BI stack.
97% accuracy on Amazon benchmarks · no credit card · book a 15-min call →