
Key takeaways
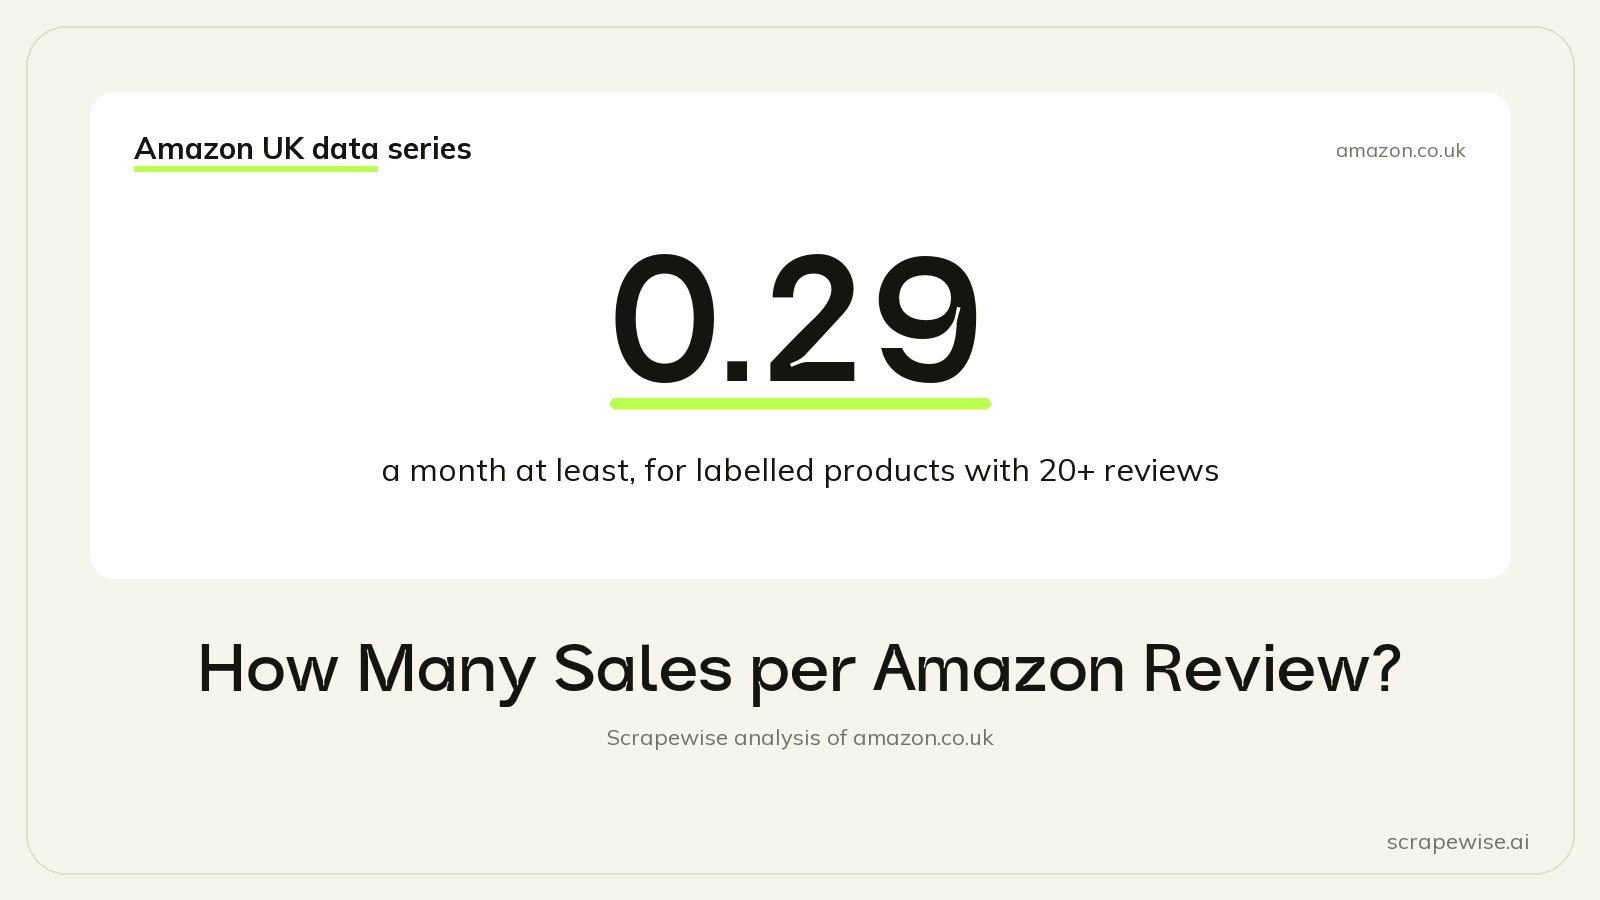
- Labelled products with 20+ reviews sell a median of at least 0.29 units a month per lifetime review.
- Of the reviews on rated products, the top 1% of products hold 37% and the bottom 50% hold 0.9%.
- The most reviewed product carries 928,000 reviews, pooled across its variants.
For an Amazon sales estimate from reviews, our data gives a floor: labelled products with 20+ reviews sell a median of at least 0.29 units a month per lifetime review, measured across 66,181 products. We checked review counts and sales labels in a snapshot of amazon.co.uk taken on 23 to 24 September 2026.
The Data
Amazon does not publish sales numbers, but it shows two public signals on every search result: how many reviews a product has, and for busier products a "bought in past month" label. Put the two side by side and you get a rough rule of thumb for turning reviews into sales.
| Measure | Value |
|---|---|
| Labelled products with 20+ reviews in the ratio | 66,181 |
| Median units a month per lifetime review | at least 0.29 |
| Reviews on rated products in the sample | 285.6 million |
| Share of those reviews held by the top 1% of products | 37% |
| Share held by the top 10% | 79.7% |
| Share held by the bottom 50% | 0.9% |
| Products with 10K+ reviews | 2.8% |
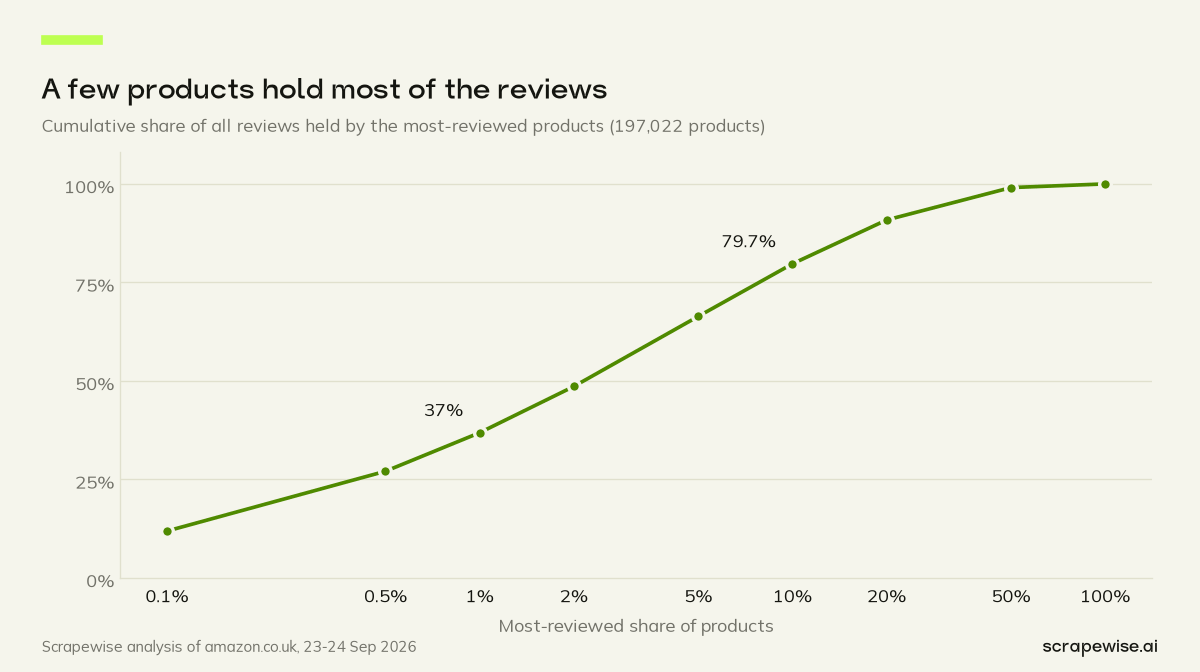
The headline ratio and the concentration curve answer two different questions. The ratio says what one review is worth in sales. The curve says why most products have very few reviews to work with.
How the Ratio Works
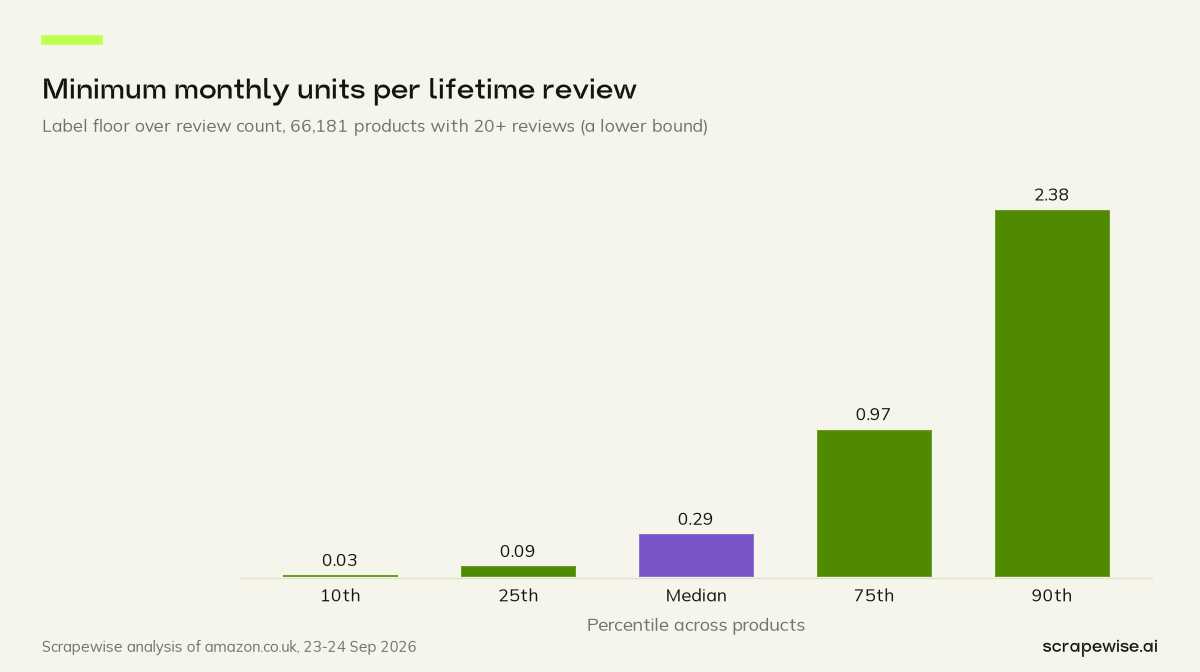
For each product that showed a sales label and had 20+ reviews, we divided the label's floor by the lifetime review count. A product labelled "1K+ bought" with a few thousand reviews gives a ratio well under one. The median across 66,181 such products is 0.29.
Put in words, the typical labelled product sells at least about three units a month for every ten reviews it has collected over its life. A listing with a few hundred reviews and a matching label is selling at least dozens of units a month. That is a floor, not a forecast.
The spread around the median is wide. Newer listings that have not yet collected many reviews can sell more units a month than they have reviews in total. Long-established products can sell a small fraction of a unit per review. The second chart shows how far the ratio runs either side of the median.
We set the cut-off at 20+ reviews because tiny review counts make the ratio jump around. A product with two reviews and a "50+ bought in past month" label would give a ratio far above the rest and tell you very little.
Why It Is a Floor, and Where It Breaks
Four things limit what the ratio can tell you.
The label is a minimum. Amazon rounds the label down to a step such as "100+ bought" or "1K+ bought", and a product labelled "1K+ bought" may sell far more. So the true ratio for each product is at least the value we compute.
Reviews build up over a lifetime. A product that has sold for years carries reviews from all of those years, while the label counts one month. Older products get a lower ratio even if they sell well today.
Unlabelled products are out. A product below the "50+ bought in past month" step shows no label, so it has no floor to divide. The ratio describes products that already sell at a visible level.
Variants blur the picture. Amazon pools reviews across sizes and colours on one listing, and large review counts are shown rounded. A single listing can carry the reviews of many products.
Reviews Pile Up at the Top
The review count itself is heavily skewed. Of the 285.6 million reviews on rated products, the top 10% of products hold 79.7%. Reviews are not shared out fairly: the top 1% of products hold 37% of them, and the bottom 50% make do with 0.9%.
The extremes are large. The most reviewed product in our sample carries 928,000 reviews, pooled across the variants of one listing. 2.8% of products have 10K+ reviews. Products labelled 5K+ bought have a median of 6,800 reviews.
At the other end, a high star rating often sits on very few reviews. Products rated 5.0 stars have a median of 2 reviews, and products rated 4.9 a median of 20. A star rating with that few reviews says little about sales. We look at this in detail in is 5 stars on Amazon trustworthy, and at what counts as a strong score in what is a good Amazon rating.
What It Means for Sellers, Brands and Analysts
Use the ratio to size, not to count. Multiply a competitor's review count by 0.29 and you get a rough, conservative guess at its monthly units, if it shows a label and has 20+ reviews. It is good enough to rank rivals or to size a niche. It is not good enough for a stock order.
Compare like with like. A two-year-old listing and a two-month-old listing with the same review count are probably selling at very different rates. Where you can, compare products of a similar age in the same search.
Watch review growth instead of review totals. The number of new reviews a product gains in a month is closer to its current sales than the lifetime total, because it ignores the old ones. That needs the same searches collected on a schedule, so you can see the change between runs.
Check the category before you compare. Products people buy again and again may collect fewer reviews per sale than one-off purchases, since a repeat buyer is unlikely to review the same item again. A ratio that looks low in a consumable category may be normal there.
Do not chase review counts alone. With 1% of products holding 37% of reviews, most new listings will never look like the leaders. A clear sales label and steady review growth say more about current sales than the total does. For the wider case on using competitor data beyond price, see beyond price tracking, and for the full dataset, our Amazon UK marketplace statistics report.
How We Collected This Data
Both halves of the ratio came from the same place, the Amazon Search API. It read seven results pages for each of 868 searches on amazon.co.uk and returned every product's review count, star rating and "bought in past month" label. Those three fields gave us the ratio and the review concentration curve.
The Amazon Search API costs €0.00015 per call, or €0.15 per 1,000 calls. Run it daily, every few days, weekly or monthly, or on demand, and the price history in the dashboard shows what changed after each scheduled run. Create an account to track review growth on your own searches.
Need a sales floor for the listings you compete with? Run your first 5 free requests on them, then pay as you go. Sign up here or compare pricing.
Paste a marketplace URL — get structured market data
Size categories, track assortments, monitor trends. Clean feeds ready for your BI stack.
97% accuracy on Amazon benchmarks · no credit card · book a 15-min call →