
Key takeaways
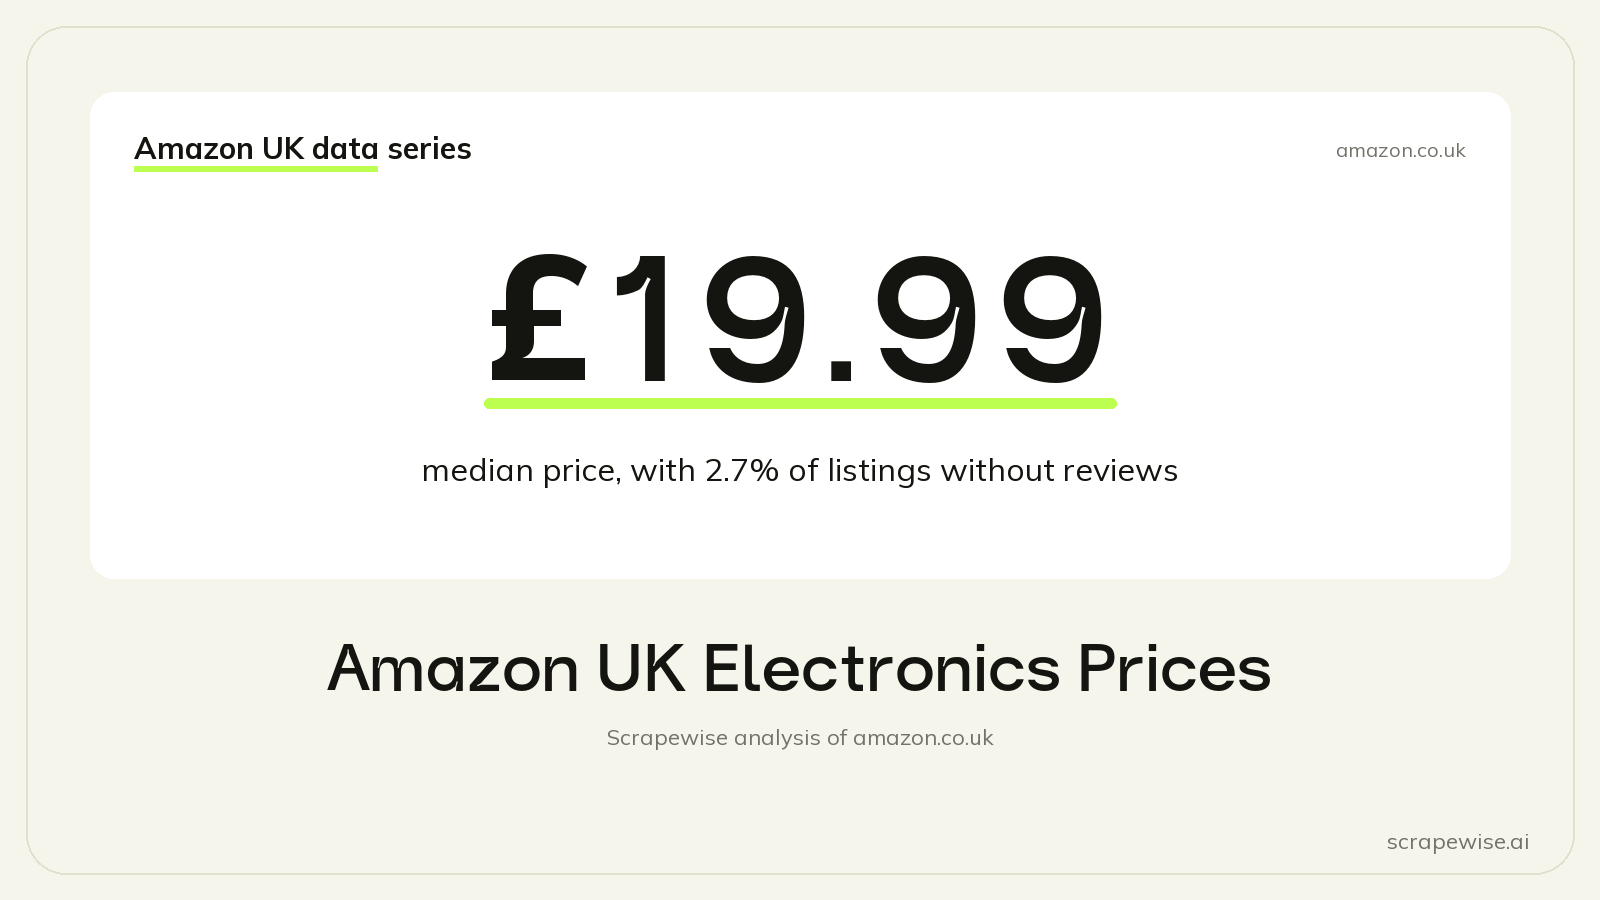
- Priced electronics have a median price of £19.99 on Amazon UK, against £16.99 for the whole priced sample.
- China-based sellers hold 55.4% of single-seller electronics listings, and UK-based sellers 14.5%.
- Just 2.7% of electronics listings have no reviews, against 7.3% across the whole sample.
Amazon UK electronics prices sit a little above the site as a whole: priced electronics have a median price of £19.99, against £16.99 for the whole priced sample, and 51.3% of electronics listings show a "bought in past month" label. We checked the electronics searches in a snapshot of amazon.co.uk taken on 23 to 24 September 2026.
The Data
Electronics is a mid-priced, busy category with unusually few unreviewed listings.
| Measure | Electronics & Computing | Whole sample |
|---|---|---|
| Median price, priced products | £19.99 | £16.99 |
| Share with a sales label | 51.3% | 36.6% |
| Share labelled 1K+ bought | 9.5% | 3.6% |
| Share with no reviews | 2.7% | 7.3% |
| Priced products ending in .99 | 54.9% | 49.5% |
| Units a month, at least | 2.55 million | 29.5 million |
The unit floor is a lower bound. Electronics listings sold at least 2.55 million units a month in our sample, built from Amazon's rounded "bought in past month" labels, so the real figure is higher.
Sales Labels and Charm Prices
Electronics is one of the busiest categories in our data. 51.3% of electronics listings show a "bought in past month" label, second only to beauty, and 9.5% show a "1K+ bought" label, against 3.6% across the whole sample. Cables, chargers and storage are items people buy often and replace when they break or get lost, which is a plausible reason for the high label share.
Electronics also leans on the .99 ending a little more than the site as a whole. Among priced electronics, 54.9% of prices end in .99, against 49.5% across all priced products. A £19.99 median sits right on that habit. The wider pattern, including how Amazon itself prices, is in our post on psychological pricing on Amazon.
Price Spread Inside Electronics Searches
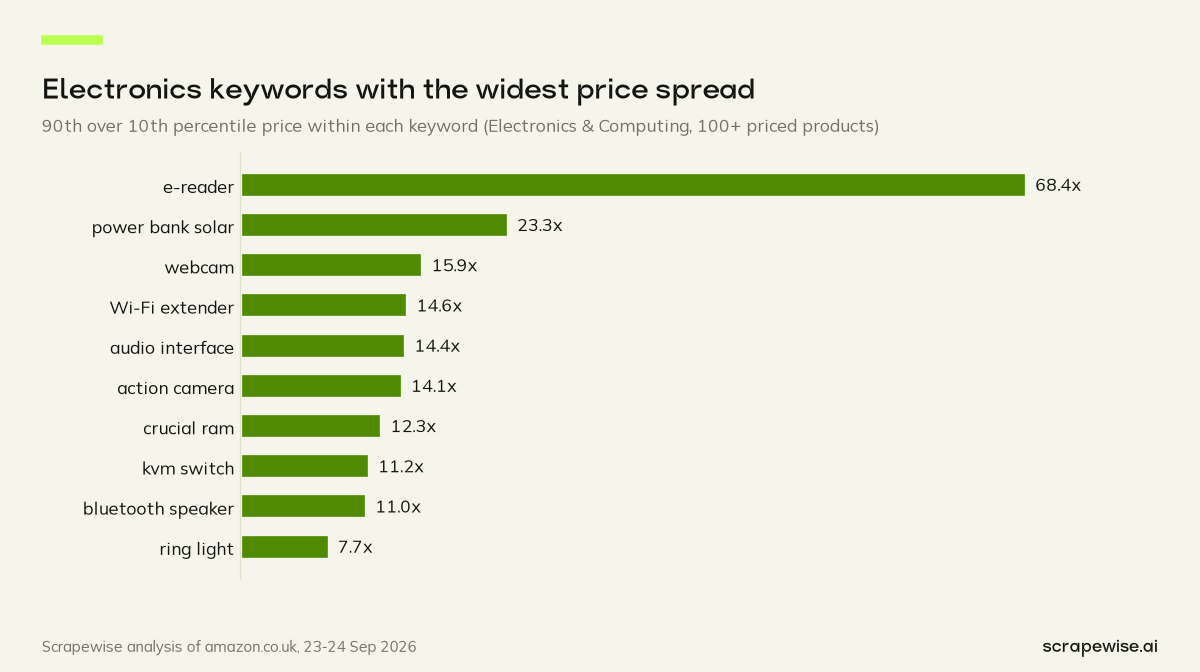
A median price says little about one search. We measure spread with the p90/p10 ratio: the price near the top of a search divided by the price near the bottom. Across all priced products, it is 10.6x.
The chart shows where electronics stretches furthest. The widest searches mix two kinds of product under one keyword. An e-reader search, for example, is likely to return cases and covers next to the devices themselves, so the cheap end and the dear end are not the same product at all. Audio interfaces and webcams range from basic units to studio kit. Drones, which our keyword list files under toys rather than electronics, spread 27.8x among priced listings.
Titles do not settle it either. One microSD card appeared at £19.00 on one listing and £299.99 on another, under an identical title. The capacity, we assume, was different. Identical titles are not identical products, which is why price comparison needs more than a name match. Our post on same product, different price on Amazon looks at 5,228 such title groups.
This matters most for anyone who compares prices automatically. A script that matches listings on title alone will compare a small card with a large one and report a price war that is not there.
A price monitor for electronics needs two rules. Compare like with like on specs, not titles. And use the median of a search rather than its mean, because a few high-end models pull a mean a long way. For a wider look at the category-level medians, see average price on Amazon UK by category.
Who Sells Electronics
On single-seller electronics listings, China-based sellers hold 55.4% and UK-based sellers 14.5%. That is one of the widest gaps of any category in our data.
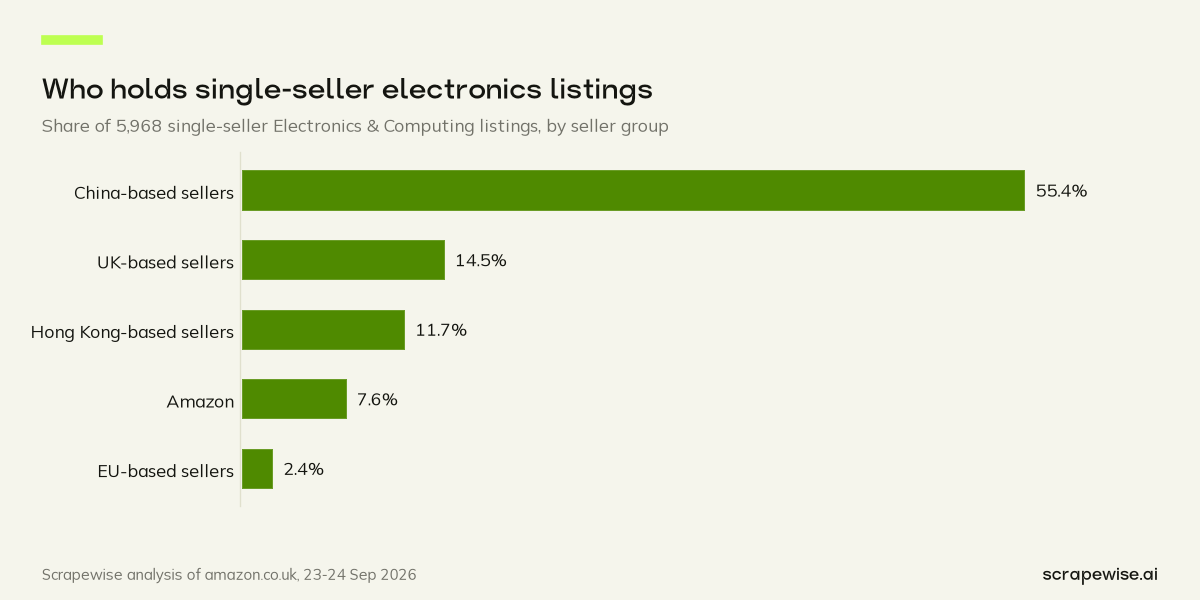
Two caveats sit next to that number. Seller country means the business address a seller declares on its profile, not where the goods are made or stored. And the base is single-seller listings. That leaves out every listing with more than one seller, including many branded devices that several retailers stock. Across categories, the same pattern holds: the seller mix follows the product type. Our post on UK vs Chinese sellers on Amazon has the full comparison.
Reviews and Used Offers
Electronics buyers leave reviews. Just 2.7% of electronics listings have no reviews, against 7.3% across the whole sample and 15.5% in sports. People who buy a charging cable, it seems, have opinions about it.
Few unreviewed listings also means new entrants start behind. A new electronics product competes with listings that already carry reviews, and there are fewer quiet corners than in sports. Our post on what counts as a good Amazon rating shows where the rating bar sits.
The offer pages show a second habit. In our offer export, 21.0% of electronics products had a used offer next to the new ones, against 7.6% of all products in the export. Used and renewed offers are a bigger part of the electronics price picture than of most categories, so a price check that reads only the featured offer can miss the cheapest route to the same product.
What It Means for Sellers and Brands
For sellers, the category median of £19.99 hides very different searches. Pick your benchmark at keyword level, and check whether the search mixes accessories with devices before you read anything into its spread.
For brands, identical titles at very different prices are the main trap. Match on model number and capacity, not on the product name, before you flag a reseller for undercutting. Our guide to electronics price tracking tools covers how to set that up, and MAP monitoring for brands covers price policies.
Watch the used offers as well. With used copies this common, a new-only price check misses part of what shoppers can see.
For analysts, keep used offers and new offers apart, and report the base. A share of single-seller listings, a share of all listings and a share of offers are three different numbers. For the same measures across every category, see our Amazon UK marketplace statistics.
How We Collected This Data
This post uses all three Scrapewise Amazon scrapers. The Amazon Search API ran on amazon.co.uk for 868 keywords, pages 1 to 7, and returned price, rating, review count, title and the sales label for each electronics listing. The Amazon Offers API returned every offer on a product, with its seller, price and condition, which showed us the used offers. The Amazon Seller API returned each seller's declared business address, which gave us the seller mix; we publish only aggregates.
All three cost €0.00015 per call, or €0.15 per 1,000 calls. On a schedule they keep a price history, so a price move on a model you track shows up after the next run. Create an account to track the electronics searches you sell in.
Try it on one electronics search first: 5 free requests cover a few results pages, and after that you pay per call. Sign up or read the pricing.
Paste a marketplace URL — get structured market data
Size categories, track assortments, monitor trends. Clean feeds ready for your BI stack.
97% accuracy on Amazon benchmarks · no credit card · book a 15-min call →