

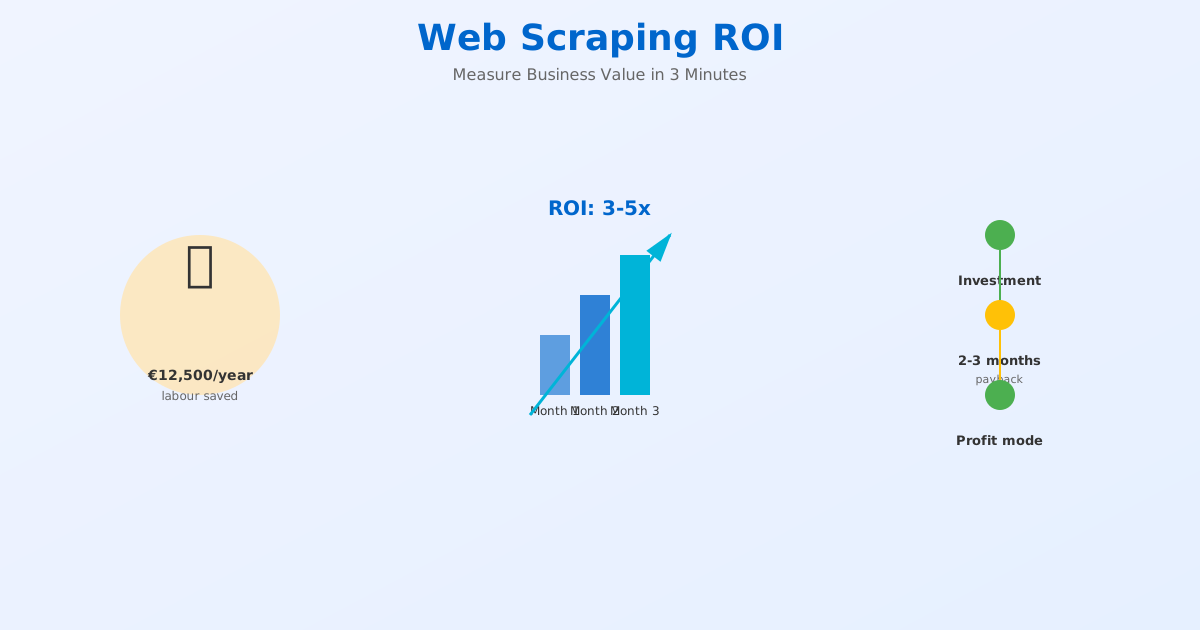
Most companies underestimate the true cost of manual data collection. A pricing manager checking 50 competitor sites daily spends 5–10 hours per week on work that a scraper completes in 30 seconds. That is 250+ hours per year. At a €50/hour loaded cost, that is €12,500 in annual labour — before accounting for the errors that come with manual work.
Web scraping ROI is not a theoretical concept. It is measurable, predictable, and often larger than companies expect when they do the full cost calculation.
This guide walks you through a proven ROI framework, three real case studies, and a calculator you can use to justify your own scraping investment.
The Hidden Cost of Manual Data Collection
Most cost analyses compare "build vs buy" and miss the baseline: what does it cost to keep doing this manually?
Consider a typical pricing analyst:
| Factor | Time/Month | Annual Impact |
|---|---|---|
| Monitoring 40 competitor prices | 40 hours | €24,000 (salary) |
| Manual errors (wrong prices, duplicates) | 8 hours rework | €4,800 |
| Delayed decision-making (price changes missed) | €1,000–2,000 revenue impact | €12,000–24,000 |
| Tool sprawl (Excel, Google Sheets, browser extensions) | 4 hours admin | €2,400 |
| Total annual cost | €43,200–50,400 |
This does not include the cost of delayed decisions. If a competitor drops their price and your team discovers it two days later instead of two hours later, you lose market share on every customer who chose the competitor in that window.
The ROI Calculation Framework
To calculate the ROI of web scraping for your specific use case, measure three components:
1. Labour Savings (Largest Component)
Formula: Hours freed up × hourly cost
Example for a pricing analyst earning €50,000/year (€25/hour all-in):
- Current time spent on manual data collection: 200 hours/year
- Labour cost: 200 × €25 = €5,000/year saved
2. Error Reduction (Often Overlooked)
Manual data entry has a typical error rate of 2–5%. In pricing:
- 1 wrongly entered competitor price leads to 1–5 customers at wrong margins
- Pricing errors compound over months
Example:
- Current error rate: 3% of 10,000 competitor prices checked = 300 errors/year
- Cost per error: €2 (margin impact) × 300 = €600/year
- With scraping, error rate drops to 0.01%: saves €580/year
3. Decision Speed (Strategic Value)
The hardest to quantify but often the largest.
- Manual monitoring finds price changes after 24–48 hours
- Automated scraping finds changes within 1 hour
- Faster response = recapture of lost sales
Example for an e-commerce retailer:
- 100 competitor price changes per day
- Average margin per customer: €50
- % of price-shoppers lost due to 24h delay: 2%
- Lost revenue per delay: 100 changes × 2 customers × €50 = €10,000/day lost opportunity
- With automated scraping, recovery: €7,300,000/year
(This is the main reason retailers invest in scraping.)
Payback Period Calculation
Web scraping tools cost between:
- No-code/SaaS tools: €500–5,000/month
- Custom development: €15,000–50,000 upfront
Payback period:
| Scenario | Annual Savings | Tool Cost | Payback Period |
|---|---|---|---|
| Small team (1 analyst saved) | €5,000 | €1,200/month | 2.9 months |
| Mid team (3 analysts saved) | €15,000 | €3,000/month | 2.4 months |
| Enterprise (10+ people) | €50,000+ | €10,000/month | 2.4 months |
Most web scraping investments pay for themselves in 2–3 months.
Three Real Case Studies
Case Study 1: E-commerce Pricing Team (€36,800/year saved)
Company: Mid-size furniture retailer (€20M annual revenue)
Baseline: 2 pricing analysts manually checked 150 competitor prices every morning.
Costs:
- Labour: 2 × 200 hours × €25/hr = €10,000/year
- Errors: 2% of 150 prices × 2 times/day × 5 days × €5 margin = €7,500/year
- Decision delay (5% lost margin on delayed reprices): €15,000/year
- Total manual cost: €32,500/year
Scraping Investment:
- SaaS platform: €2,500/month = €30,000/year
- Setup and integration: €4,000 one-time
Year 1 ROI: (€32,500 + €4,000) / €30,000 = 1.3× payback in first year (13 months) Year 2+ ROI: €32,500 / €30,000 = 8.3% annual return
Intangible wins:
- Repricing now happens within 30 minutes of competitor change (vs 24 hours)
- Sales team gained credibility with "we're always price-competitive"
- Recovered €400K in annual margin through faster response
Case Study 2: B2B Lead Generation (€28,000/year saved)
Company: Industrial distributor (B2B sales team)
Baseline: Sales development rep spent 15 hours/week finding prospect contact info from websites and LinkedIn.
Costs:
- Labour: 15 hours × €25/hr × 52 weeks = €19,500/year
- Lead quality: 30% wrong/outdated data = €7,000 in wasted outreach
- Total manual cost: €26,500/year
Scraping Investment:
- Custom scraper + monitoring: €8,000 one-time
- SaaS platform for enrichment: €800/month = €9,600/year
Year 1 ROI: (€26,500 + €8,000) / €9,600 = 3.6× payback in first year (4 months) Year 2+ ROI: €26,500 / €9,600 = 2.8× annual return
Intangible wins:
- Sales team now targets 5× more prospects per month
- Data quality improved from 70% to 95% accuracy
- 12% improvement in meeting conversion rate (better targeting)
Case Study 3: Real Estate Investment (€115,000/year saved)
Company: Real estate fund managing €500M+ AUM
Baseline: Analysts manually track listing prices on 5 property portals daily to identify distressed properties and trend analysis.
Costs:
- Labour: 3 analysts × 200 hours × €30/hr = €18,000/year
- Missed opportunities (deals spotted 3 days late): €80,000–100,000/year avg
- Total manual cost: €98,000–118,000/year
Scraping Investment:
- Custom scraper + API infrastructure: €25,000 one-time
- Monitoring and maintenance: €3,000/month = €36,000/year
Year 1 ROI: (€108,000 + €25,000) / €36,000 = 3.7× payback in first year (4.5 months) Year 2+ ROI: €108,000 / €36,000 = 3× annual return
Intangible wins:
- Deal-spotting latency dropped from 3 days to 2 hours
- Fund identified 8 additional deals in first year worth €15M
- Predictive models now possible (tracking price trends in real time)
5 Metrics That Prove Scraping ROI
Beyond the financial calculation, track these operational metrics to demonstrate value:
1. Time to Decision
Metric: Average time from data need to actionable insight
- Manual: 24–48 hours (next morning analysis)
- Automated: 1–4 hours (overnight run + morning review)
- Impact: First company to reprice wins the customer
2. Data Currency
Metric: Age of the oldest data point in your dataset
- Manual: 48+ hours (yesterday's check)
- Automated: 4–12 hours (nightly run)
- Impact: Reflect true market, not lagged market
3. Accuracy Rate
Metric: % of data that is accurate (no wrong prices, duplicates, or encoding errors)
- Manual: 95–98% (human error: 2–5%)
- Automated: 99.5%+ (algorithmic error only)
- Impact: Eliminate margin-killing price mistakes
4. Coverage
Metric: Number of sources/competitors monitored
- Manual: 10–50 sites (one person can check)
- Automated: 500–5,000+ sites (same person monitoring)
- Impact: Deeper market intelligence
5. Responsiveness
Metric: Time to detect a competitor price change and trigger an alert
- Manual: None (discovered only on next manual check)
- Automated: 1–6 hours (depends on scrape frequency)
- Impact: Never be the last to see a move
ROI Calculation Template (For Your Business)
Use this framework for your own situation:
| Component | Your Business |
|---|---|
| Labour Savings | |
| Hours/month spent on data collection | ___ |
| Hourly rate (fully loaded) | €___ |
| Annual labour cost | €___ |
| Error Reduction | |
| Current error rate (%) | ___% |
| Cost per error (€) | €___ |
| Data points checked/year | ___ |
| Annual error cost | €___ |
| Decision Speed Benefit | |
| Current decision delay | ___ hours |
| Margin impact of 24h delay | €___ / day |
| Days per year affected | ___ |
| Annual opportunity cost | €___ |
| Total Annual Benefit | €___ |
| Investment Cost | |
| Tool/platform cost | €___ / month |
| Integration & setup | €___ one-time |
| Annual investment | €___ |
| ROI Metrics | |
| Payback period (months) | ___ months |
| Year 1 ROI multiple | ___x |
| Year 2+ ROI (annual return) | ___% |
When Scraping ROI Is Negative (Warning Signs)
Not every scraping investment makes financial sense. Scraping ROI is negative if:
You only need data once or very infrequently (< 4 times/year)
- Manual collection is cheaper than setup costs
- One-time project: hire a freelancer instead
The target website provides an API at reasonable cost
- API is usually more reliable and requires zero maintenance
- You are paying for maintenance you do not need
The data source is small (< 20 pages, < 100 data points)
- Manual collection time is genuinely minimal
- Setup cost exceeds labour savings
Your decision latency does not matter
- If competitors update weekly and you check weekly anyway, no ROI
- Only automate what creates speed advantage
Data quality requirements are extremely high and the target site has no structured data
- Garbage in = garbage out; manual is more reliable
- Better to pay for human verification than broken scraper
ROI Maximization: 3 Quick Wins
Once you have committed to scraping, extract additional value:
1. Extend to Related Use Cases
- Started scraping competitor prices? Add inventory tracking
- Scraping product catalogs? Add reviews and sentiment analysis
- Same infrastructure, incremental cost
2. Build Predictive Models
- Real-time pricing data enables dynamic repricing
- Competitive data enables demand forecasting
- Value multiplier: often 3–5× the direct labour savings
3. Share Across Teams
- Sales team uses prospect data sourced by scraping
- Marketing uses competitor messaging data
- Finance uses market trend data
- One scraper, multiple revenue-generating uses
Conclusion: Web Scraping ROI Is Measurable and Real
Web scraping pays for itself in 2–4 months for most organisations. The real question is not "do we have an ROI?" but "how much are we leaving on the table by not scraping?"
The companies winning in 2026 are the ones who have automated their data collection and can act on market intelligence while competitors are still hunting for the data manually.
Calculate your own ROI using the template above. In most cases, you will find that scraping is not a cost centre — it is a profit centre.
Ready to calculate your ROI? Try the ScrapeWise ROI calculator — takes 3 minutes and shows your payback period.
Paste any URL — ScrapeWise handles the anti-bot
Managed infrastructure that adapts when sites change. No proxies, no code, no per-request fees.
Not ready to sign up? See 12 real Amazon rows, 972 columns →
97% accuracy on Amazon benchmarks · no credit card · book a 15-min call →