
Key takeaways
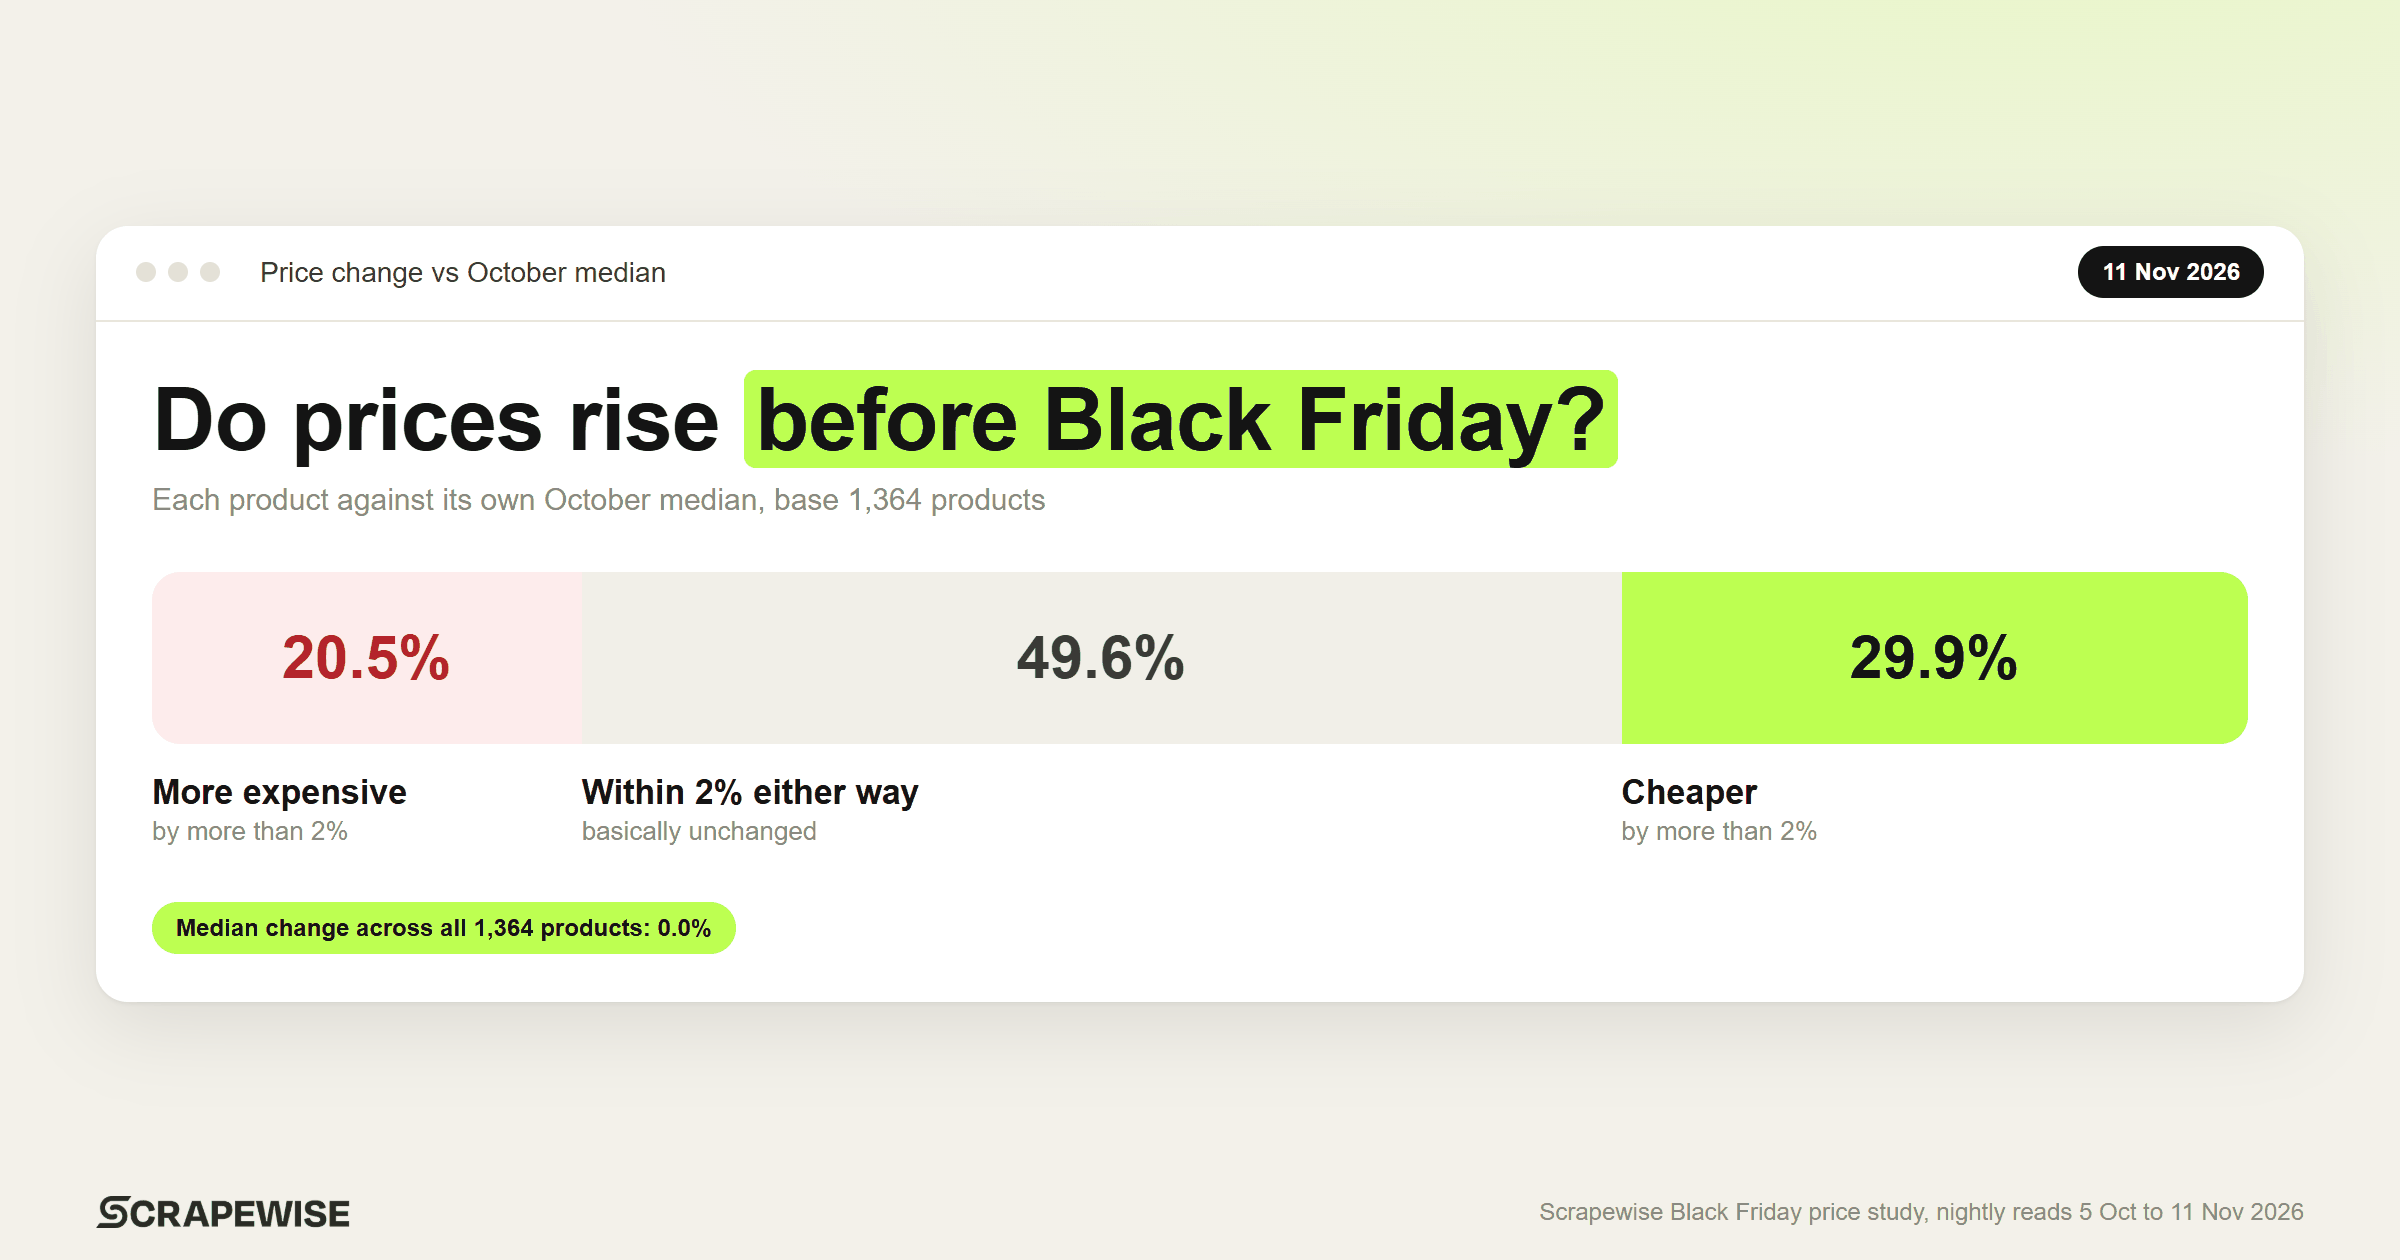
- By 11 November, 20.5% of the 1,364 products cost more than their own October median and 29.9% cost less, so the typical product had not gone up.
- The median change across all 1,364 products was 0.0%.
- Among the products that did rise, the typical rise was 12.5% and the top tenth rose by 38% or more.
Everybody has heard it: shops quietly raise prices in October so the November discount looks bigger. It is easy to say and hard to check, because checking needs somebody to have written the October prices down before anyone knew which products would go on sale.
We wrote them down. Since 5 October 2026 we have recorded the price of 1,477 tracked product links at seven large EU shops, once a night, every night.
This post is only about the shelf price. No discounts, no "before" prices, no judgment about any shop. Just the question of what the price actually did in the five weeks before Black Friday.
Data and method: Scrapewise Black Friday price study, 5 October to 11 November 2026, 38 days of nightly reads across seven large EU shops in six countries, 1,477 tracked product links. The figures below use the 1,364 products (92.3%) that had a price on at least 27 of the 30 days to 11 November and on at least 20 of the 26 days from 6 to 31 October. The other 7.7% are left out and counted here rather than filled in. Days with no valid price are counted as missing and never as zero. We do not name the shops. UK shops are excluded from every figure in this post, because the 30-day rule discussed below is an EU rule.
What the prices did
Each product is compared against its own median price from 6 to 31 October. Not against a category average, not against a competitor, just against what that same product cost at that same shop in October. A change of 2% either way is treated as no change.
| On 11 November 2026, compared with its own October median | Share of 1,364 products |
|---|---|
| More expensive by more than 2% | 20.5% |
| Cheaper by more than 2% | 29.9% |
| Within 2% either way | 49.6% |
Half the products had not meaningfully moved. Of the half that had, more had gone down than up.
The median change across all 1,364 products was 0.0%. The typical product in our set cost the same in the second week of November as it did in October.
That is not what the folklore predicts, and we would have published it either way.
The products that did rise
One in five products was dearer, and those rises are not small.
Among the 280 products that rose by more than 2%, the median rise was 12.5%, and the top tenth rose by 38% or more. The largest single rise in the set was 108.5%. So "prices do not generally rise before Black Friday" and "no price near you has risen" are two very different statements, and only the first one is supported here.
The falls are a mirror image. Among the 408 products that were cheaper, the median fall was also 12.5%, and the steepest tenth had fallen by 25.4% or more. Some of that is simply early Black Week promotions, which were already running at several shops when we took this reading.
The timing supports that reading. If we run the same comparison at 31 October instead, before the early promotions started, 15.4% of products were dearer than their October median and 14.7% were cheaper, which is close to even. The extra falls arrive in November, as the sale period opens. The rises were already there in October.
This also held across the set rather than at one shop. The share of products that rose ranged from 13.5% to 32.6% depending on the shop, and no shop had a majority of its products rising. The overall figure is not one shop's behaviour carrying the rest.
What this does not say
It does not say that any shop raised a price in order to discount it later. We measured the movement. We did not measure the intent, and we cannot.
A price can move for a dozen ordinary reasons: a currency moving, a supply problem, a new model arriving and the old one being cleared, a promotion ending, a third-party seller winning or losing a listing. Reading a rise as preparation for a bigger-looking discount is a story about motive, and our data contains no motive.
The honest summary is narrow and it is this. Across 1,364 products at seven large EU shops, the typical shelf price in the second week of November was the same as in October, more products had fallen than risen, and the one in five that rose had risen by a meaningful amount.
Why the October price matters commercially
There is one reason this matters to anyone selling rather than buying, and it is worth stating plainly.
Under the EU rule, a price you raise in November does not become your "before" price in December. The lowest price in the previous 30 days does, whatever you put on the shelf afterwards. Your own October and early November prices are already locked in, and they set the reference price you are allowed to advertise against. We wrote about what the rule asks of retailers separately, and our Black Week checklist for 2026 covers the dates.
Which is really an argument for keeping the record. A shop that can show its own price per product per day, with the gaps marked as gaps, can answer a question about a reference price in a minute. A shop whose platform overwrites yesterday's price cannot answer it at all.
Keeping that record across a list of competitor product pages, nightly, with failures marked as missing rather than filled in, is what we do at competitor price tracking.
Paste a competitor URL and start tracking prices
The shops you name, as a structured table once a day at most. No code, pay per page, the first 5 requests are free.
Not ready to sign up? See 40 rows of real Google Shopping price data →
5 free requests no credit card · pay per page, no monthly plan · book a 15-min call →