

Your director asks: "Are we cheaper or more expensive than the competition?" You have a spreadsheet of competitor prices. Some products match, some don't, and one shop charges shipping. You need one number you can defend.
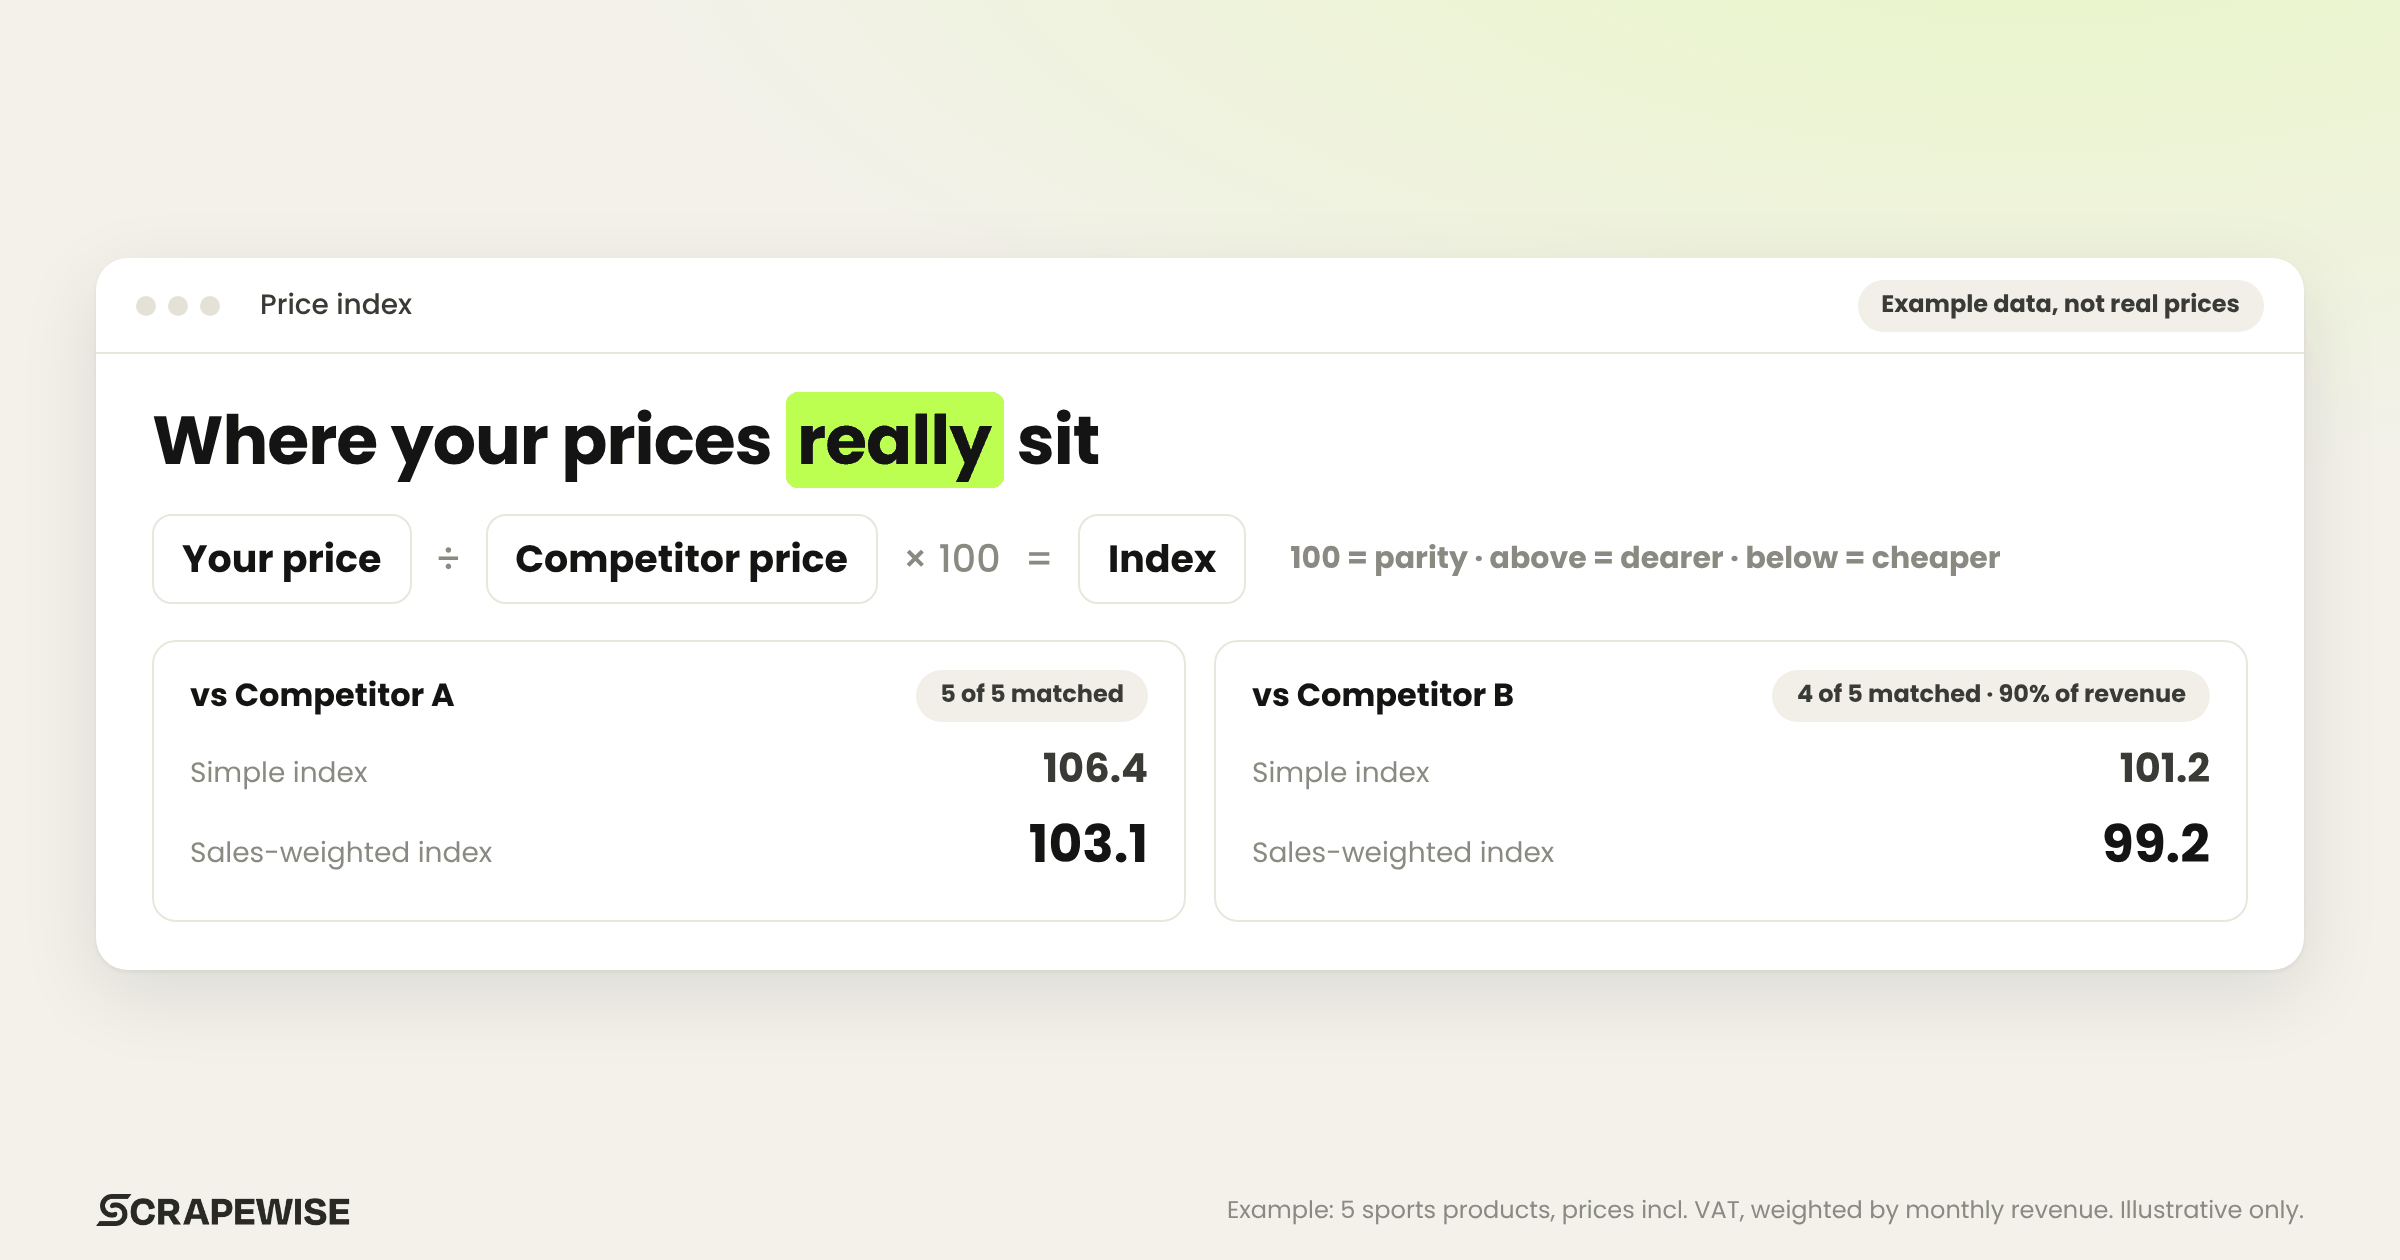
That number is a price index. The price index formula is your price ÷ competitor price × 100. An index of 100 means you match the competitor, 105 means you are 5% more expensive, and 95 means you are 5% cheaper. For a whole category, you average the product indexes and weight them by sales, so your best sellers count most.
This guide works through the price index calculation for 5 products against 2 competitors, with clearly labelled example numbers, and covers the three things that break most indexes: missing matches, shipping and VAT.
What is a competitor price index?
A competitor price index is a single number that shows your price position against one competitor or the market. It compares identical products, divides your price by theirs and multiplies by 100. A score of 100 means price parity. It turns hundreds of separate price gaps into one figure you can track week by week.
The idea is the same one statisticians use for inflation. The ECB explains that the EU's Harmonised Index of Consumer Prices weights each group of goods by "the respective share of each group in the total expenditure of all households", and that "by law, the weights are updated every year". A retail price index borrows that logic. Products people buy more of should count more.
What is the price index formula?
For one product against one competitor, the price index formula is: index = your price ÷ competitor price × 100. For a category, take each product's index, multiply it by that product's sales, add the results and divide by total sales. Use identical products, the same unit and the same currency on both sides.
Before you compare reports, check one thing. Vendors write the formula both ways round.
| Source | Formula as published | An index above 100 means |
|---|---|---|
| Dealavo | Your price ÷ average competitor price × 100 | You are more expensive |
| PriceShape | Your price ÷ competitor price × 100 | You are more expensive |
| Competera | Competitor price ÷ your price × 100 | You are cheaper |
| Prisync | Competitor price ÷ your price × 100 | You are cheaper |
| Pricefy | Competitor price ÷ your price × 100 | You are cheaper |
Both versions work. Mixing them doesn't. A tool showing "108" and a colleague's file showing "93" may agree. Write down which way round your index runs. This guide uses your price on top, so above 100 always means "we are more expensive".
How do you read 100, above 100 and below 100?
At 100 you charge the same as the competitor. Above 100 you are more expensive: 106 means 6% above them. Below 100 you are cheaper: 94 means 6% below. Many retailers treat a band around 100, often 95 to 105, as parity, and only look closer when a category leaves that band.
That band is common. Dealavo's guide labels an index of 95–105 as "price parity", below 95 as "significantly cheaper than market" and above 105 as premium positioning. PriceShape also mentions a parity range of 95 to 105, and notes that scores far below 90 can mean undercutting that hurts margins.
Where you want to sit depends on your strategy. Our sister guide site, also published by ScrapeWise, has a page on how to calculate a price index. It notes that discount retailers aim below 100, while premium retailers can hold an index above 100.
How do you calculate a price index? A worked example
Work out an index for each product, then combine them in two ways. A simple index averages the product indexes, so every product counts the same. A sales-weighted index multiplies each one by its revenue and divides by total revenue, so best sellers count most. Report both, with coverage.
Here is a full price index calculation. All numbers below are example data, made up to show the method. They are not real shop prices. The shop sells sports equipment, the prices include VAT, and shipping is ignored for now.
| Product (example) | Your price | Competitor A | Competitor B | Units sold / month | Your revenue |
|---|---|---|---|---|---|
| Running shoe | €119.00 | €109.00 | €125.00 | 120 | €14,280 |
| Yoga mat | €29.90 | €32.90 | €27.90 | 400 | €11,960 |
| Dumbbell set 20 kg | €79.00 | €74.00 | no match | 60 | €4,740 |
| Water bottle 0.75 L | €14.90 | €14.90 | €15.90 | 900 | €13,410 |
| Foam roller | €24.90 | €19.90 | €22.90 | 150 | €3,735 |
Step 1: an index per product. Divide your price by each competitor's price and multiply by 100. The running shoe against Competitor A is 119.00 ÷ 109.00 × 100 = 109.2.
| Product (example) | Index vs A | Index vs B |
|---|---|---|
| Running shoe | 109.2 | 95.2 |
| Yoga mat | 90.9 | 107.2 |
| Dumbbell set 20 kg | 106.8 | not matched |
| Water bottle 0.75 L | 100.0 | 93.7 |
| Foam roller | 125.1 | 108.7 |
Step 2: a simple index. Average the product indexes. Against Competitor A that is (109.2 + 90.9 + 106.8 + 100.0 + 125.1) ÷ 5 = 106.4. Against Competitor B, over the 4 matched products, it is 101.2.
Step 3: a sales-weighted index. Multiply each product index by that product's revenue, add them up and divide by total revenue. Against Competitor A the weighted index is 103.1. Against Competitor B it is 99.2.
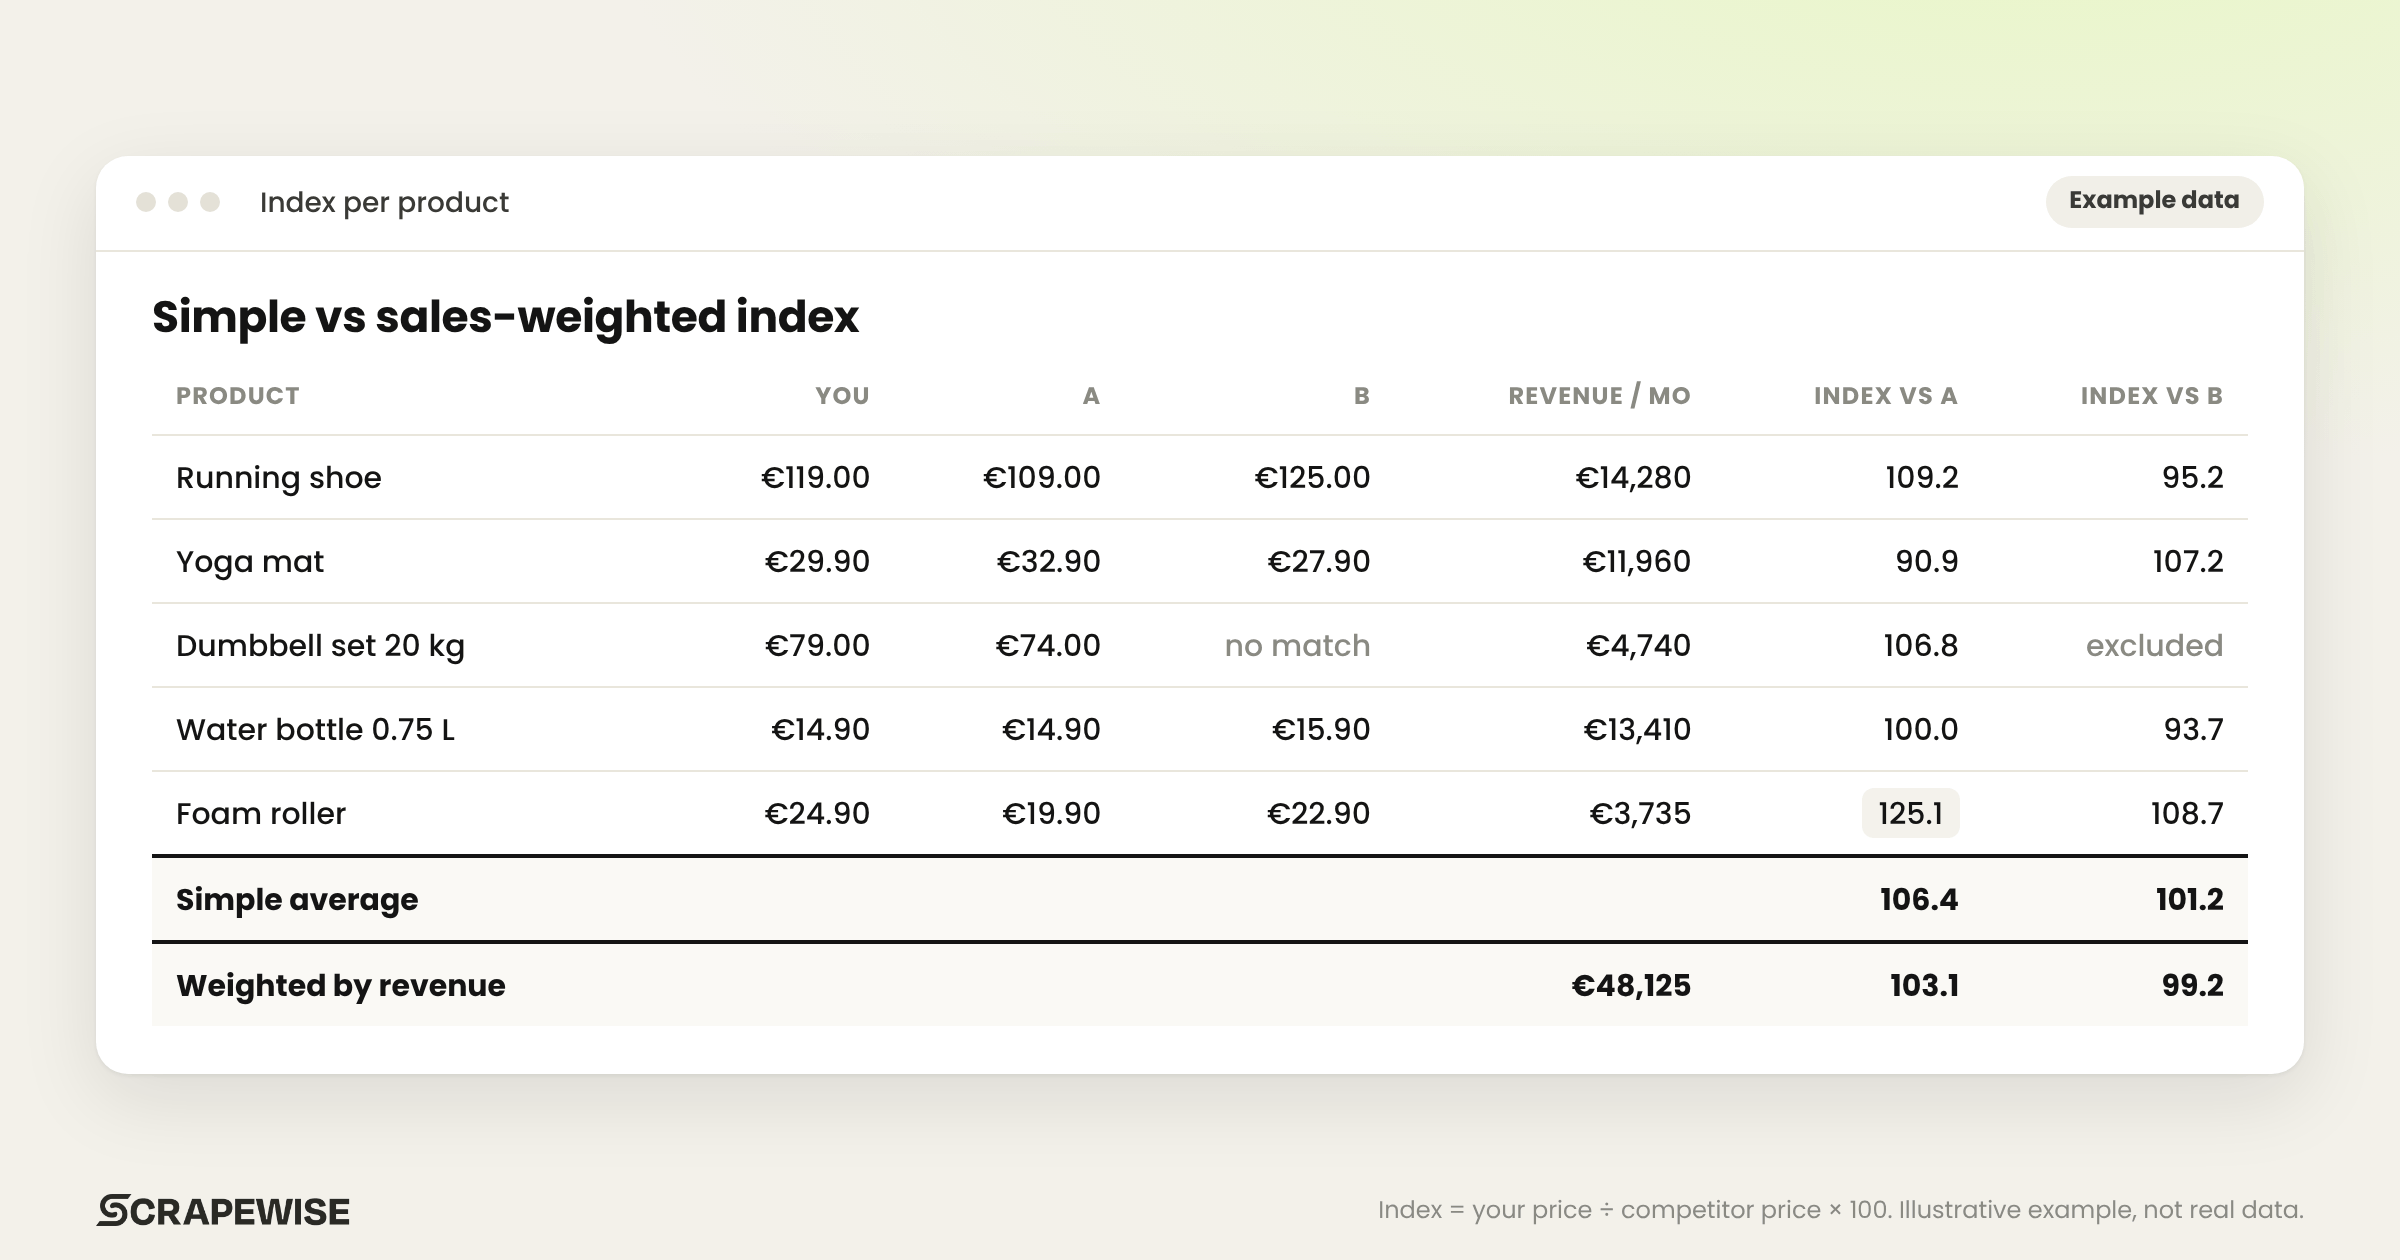
Weighting changed the answer. The simple index says you are 6.4% more expensive than Competitor A. The weighted index says 3.1%. The foam roller explains the difference: the biggest price gap (index 125.1) but the smallest revenue (€3,735). The simple index counts it as much as the running shoe; the weighted index barely notices it.
Against Competitor B the story flips. The simple index of 101.2 says you are slightly more expensive. The weighted index of 99.2 says you are slightly cheaper on what customers actually buy, mainly thanks to the water bottle and the running shoe, your two biggest products by revenue.
Report the weighted number upwards. Keep the simple one as a warning light: a big gap between the two means a few low-volume products are badly priced.
A basket version also exists: your monthly units at your prices divided by the same units at the competitor's prices. Here it gives 102.2 against A and 98.8 against B. Pick one method and keep it.
How do you handle products a competitor doesn't sell?
Leave unmatched products out of that competitor's index, never fill them with zero or a guess, and report coverage next to the index. Coverage is the share of your revenue the index is based on. An index built on 30% of your revenue says much less than one built on 90%.
In the example, Competitor B doesn't sell the dumbbell set. So the index against B covers 4 of 5 products and €43,385 of €48,125 revenue: 90.2% coverage. Write it as "99.2 (90% coverage)".
Competera's guide does the same. Its SKU table marks missing products with "-", and it averages over matched products only. None of the five vendor guides sets a minimum coverage level, so agree one with your team. If coverage drops sharply, check your matching before you trust the index.
A match also has to be the same product. "Similar products make the index meaningless," the guide site warns. Another brand's 20 kg set is not a match, and a 6-pack needs converting to a unit price first. Our guide to product data matching explains where matching goes wrong.
Should the index include shipping and VAT?
Compare prices the way your customer sees them. For consumer shops in the EU that means prices including VAT, because the Price Indication Directive defines the selling price as the final price "including VAT and all other taxes". Shipping is a choice: track the item price and the delivered price as two separate indexes.
VAT. The definitions in Directive 98/6/EC, Article 2 say both the selling price and the unit price include VAT. So consumer prices in the same country already compare like for like. Watch two cases. B2B shops often show prices without VAT, and cross-border comparisons mix different VAT rates. Convert both sides to the same basis before you divide.
Shipping. Comparison sites in the Nordics handle shipping in a way that matters here. Prisjakt Norway says the prices it shows are "eksklusive frakt" (excluding shipping) unless it states otherwise, and uses the price with shipping only as a tie-breaker. Prisjagt in Denmark says the same. PriceSpy UK lets shoppers sort by price including delivery. So shoppers on Prisjakt and Prisjagt see the item price first, and only some of them sort by the delivered price.
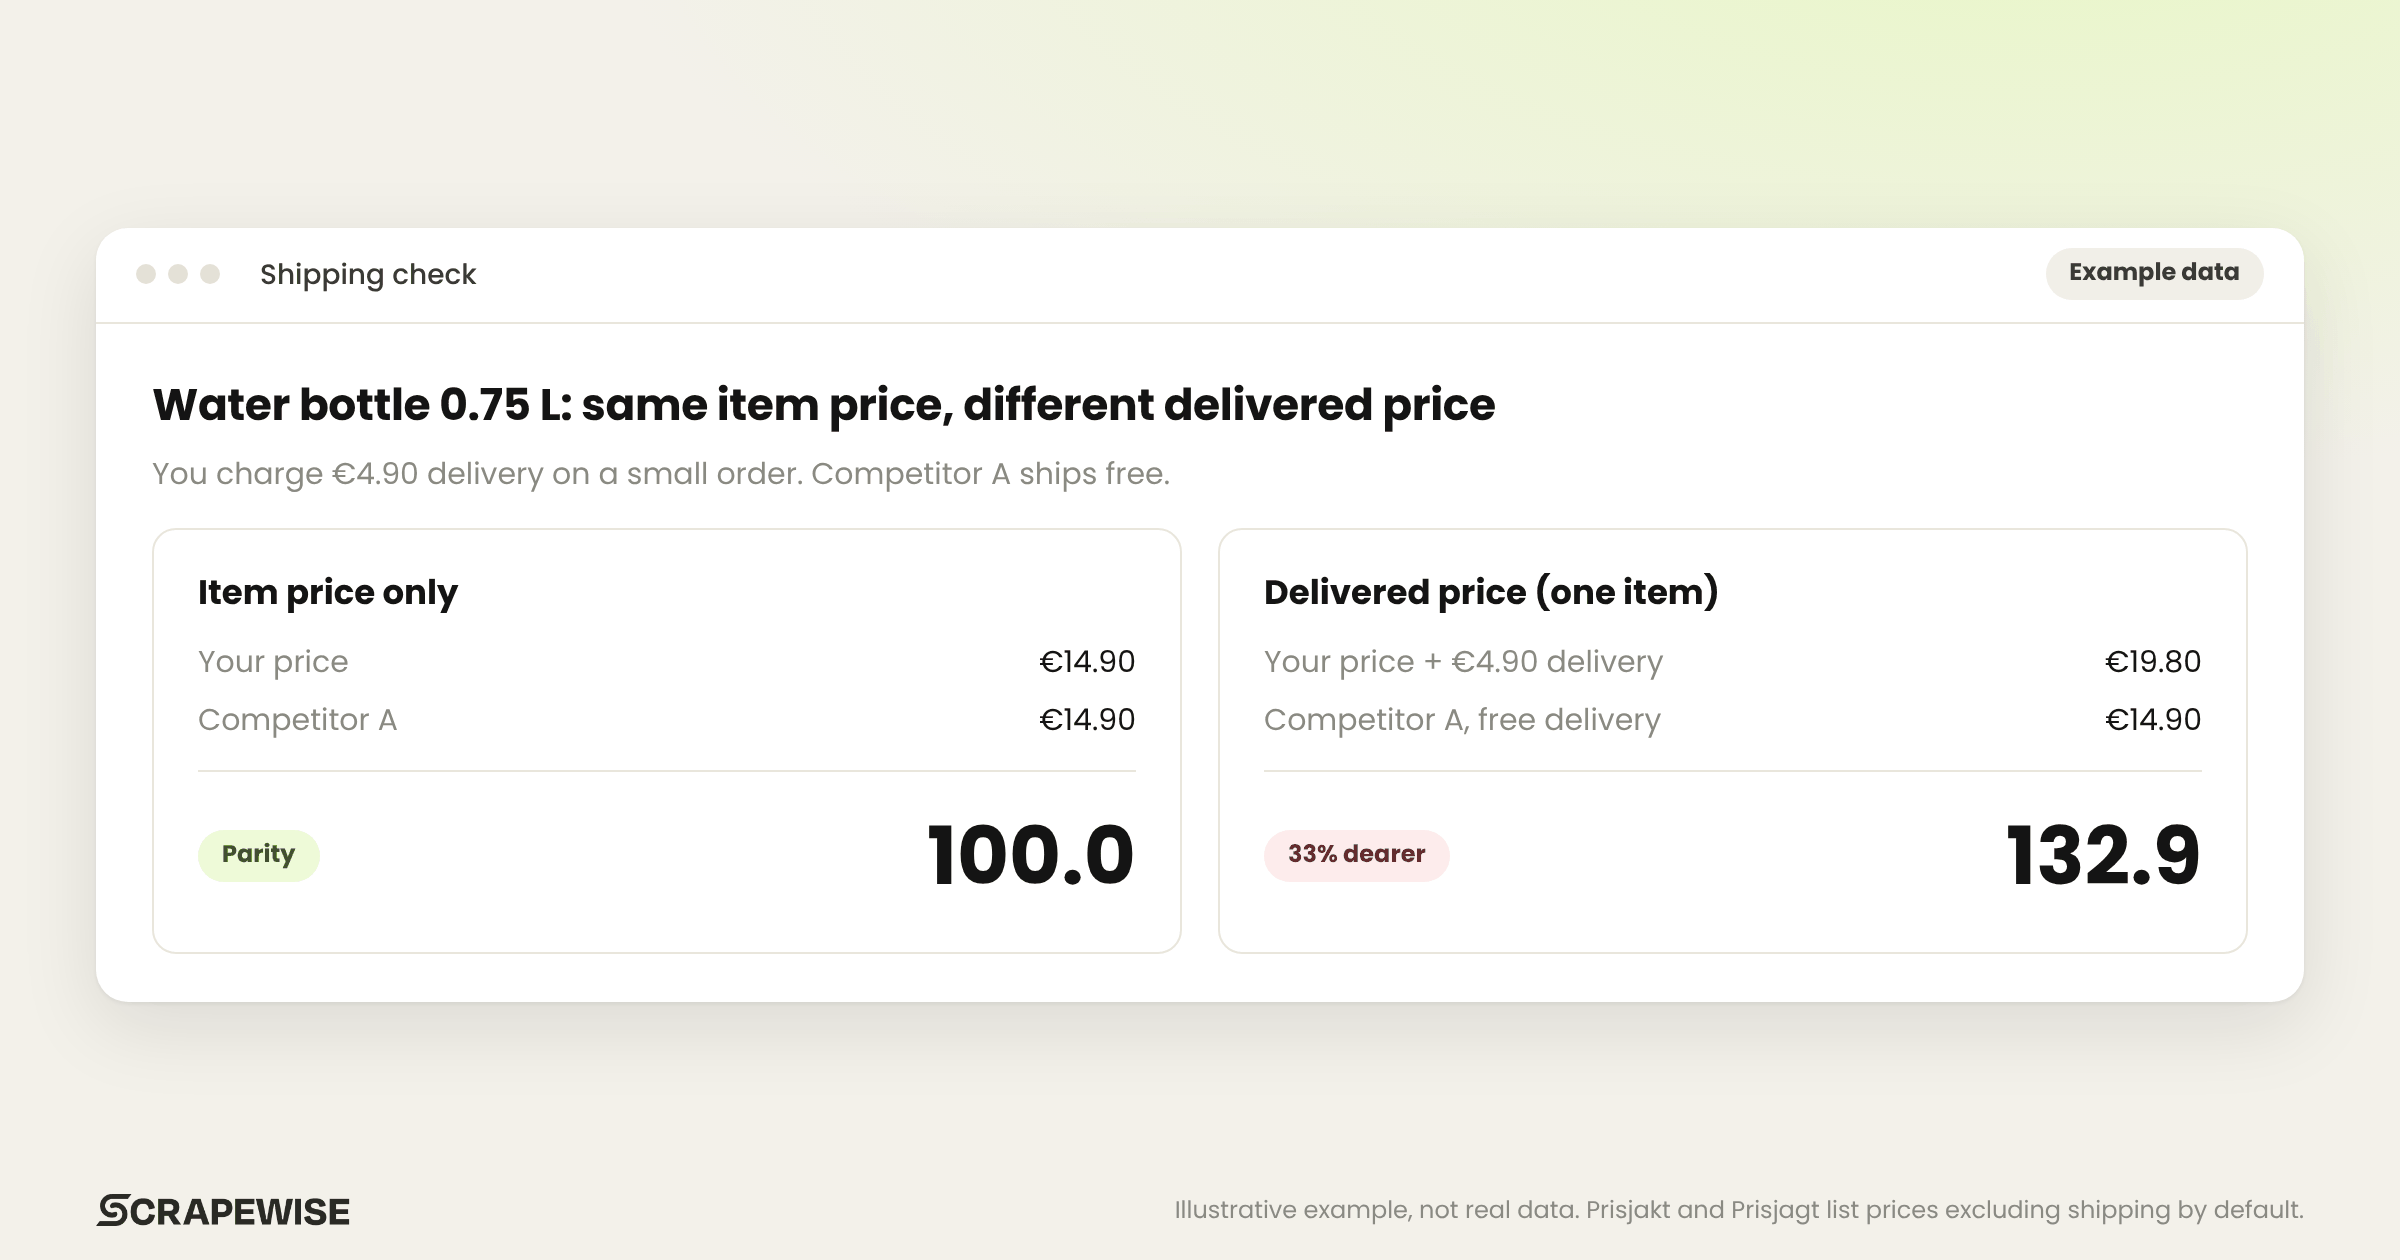
Shipping matters most for cheap items. In the example, the water bottle is €14.90 at both you and Competitor A: index 100. Now say you charge €4.90 delivery on a small order and Competitor A ships it free. For a customer buying only the bottle, your delivered price is €19.80 against €14.90, an index of 132.9. Your item index says parity, while a single-item shopper sees a 33% price gap.
Keep the item-price index as your main number, and add a delivered-price index for low-value products.
How often should you recalculate the index?
Recalculate as often as prices in the category move. For promotion-heavy categories that means weekly or more often. The guide site puts it plainly: "A month-old index misses promotions." In our experience, daily data is enough for most teams. The bigger delay is usually the process around the number.
In my experience the slow part is rarely one price. It's the Excel files emailed back and forth, each named something like "Category X_Prices_FINAL_v3.xlsx", with three people adding their input before anyone acts. In Estonia, category managers often have assistants who collect competitor prices by hand. By the time the index is ready, it describes last month.
One home and furniture retailer we work with uses the index for exactly this: a regular check of its own positioning across retailers, not a reaction to every price change. That's the right use. An index tells you where you stand. It does not tell you to cut a price because one competitor did.
When one competitor drops a price, check the weighted index and coverage first. Inside your target band, a single move is noise. A category drifting out of the band for weeks is a signal.
What do you need to build a competitor price index?
You need four things: a product list with your prices and sales, matched competitor prices for the same products, one agreed formula direction, and a regular refresh. The hard part is collecting competitor prices and matching them to your SKUs reliably.
| Option | What you get | What you still do |
|---|---|---|
| Manual collection in Excel | Full control, no tool cost | Collect, match and calculate by hand every time |
| Price monitoring software with a built-in index | Index dashboards, often per category | Check which way round the formula runs, and the matching |
| Data collection plus your own sheet or BI tool | Raw matched prices you can weight any way you like | Build the index formula once |
The same guide site, Competitor Price Comparison, compares eight options, from manual checks to enterprise platforms, and walks through the steps from choosing competitors to calculating the index. ScrapeWise, which publishes this blog, is one of the options there. It collects competitor prices on a daily schedule and matches them to your product list by EAN, title, brand, size and picture. Matching is priced at €0.15 per 1,000 products for text and EAN and €1.50 per 1,000 for pictures (minimum €1 a run). The charge is live in the wallet: a run reserves the most it can cost and settles to what it actually used (November 2026). It delivers a table rather than a finished index, so you keep control of the formula and the weights. If you want an index calculated for you, check whether a tool's comparison reports include one and which way round its formula runs.
If you are still weighing up the budget, our breakdown of competitor price monitoring costs compares the pricing models.
What should you do next?
Start small. Pick one category, your top 20 products by revenue and the two or three competitors your customers actually compare you with. Build the weighted index once by hand, using the steps above, and write down the formula direction and the coverage. That gives you a baseline in an afternoon.
Then decide how to keep it fresh. You can check a few products right now with the free competitor price checker, or set up regular competitor price tracking. If you want the numbers without the copy-paste, upload your product list and competitor URLs to ScrapeWise and get a matched price table back: the first 5 requests are free, no card needed.
Paste a competitor URL and start tracking prices
The shops you name, as a structured table once a day at most. No code, pay per page, the first 5 requests are free.
Not ready to sign up? See 40 rows of real Google Shopping price data →
5 free requests no credit card · pay per page, no monthly plan · book a 15-min call →